Bitcoin (BTC) Price Analysis: Technicals Looming Large During Pullback – 29 November 2023
Bitcoin (BTC) Price Analysis: Technicals Looming Large During Pullback – 29 November 2023
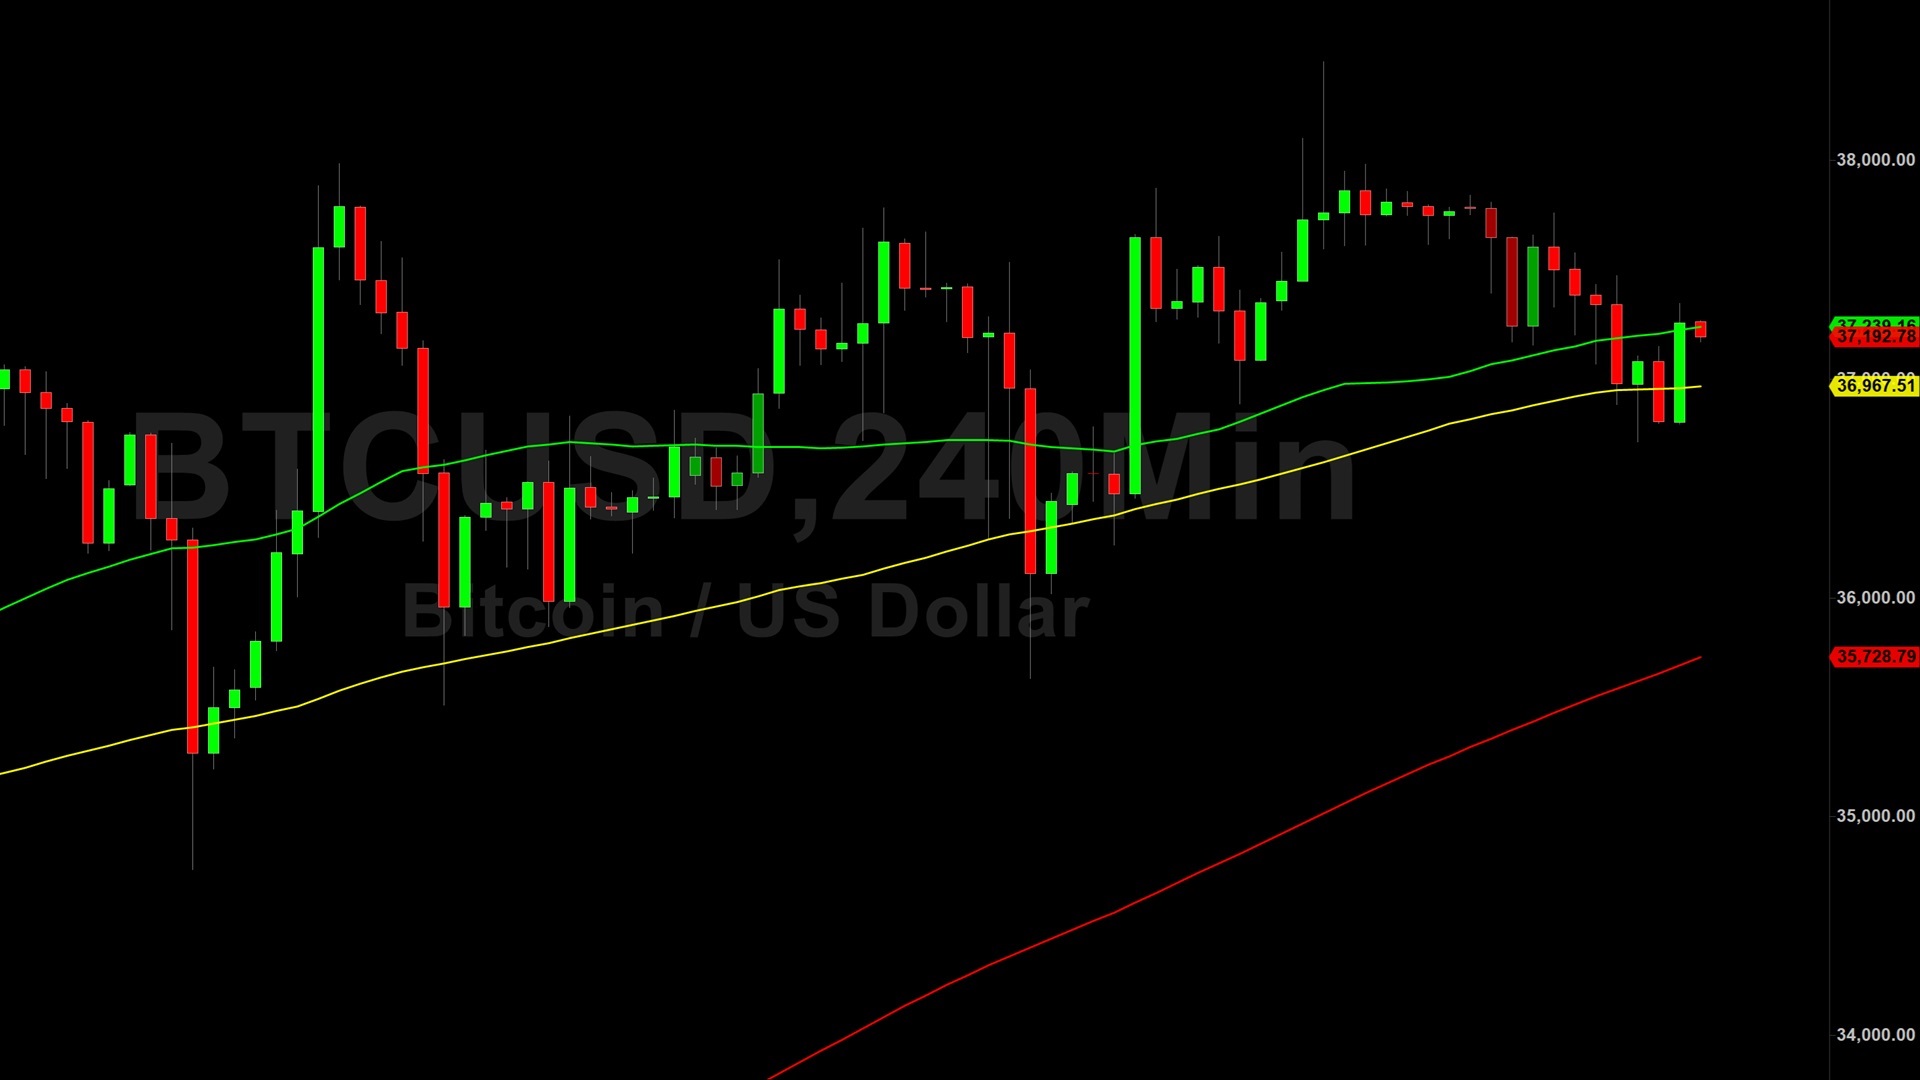
Bitcoin (BTC/USD) remained on the defensive early in the Asian session as the pair encountered additional selling pressure around the 37346.16 area, representing a test of the 50% retracement of the recent appreciating range from 36241 to 38454. Buying pressure emerged around the 36715.10 area before the descent, representing a test of the 78.6% retracement of the same appreciating range. The 36259.61 is a major downside price objective related to these levels, with Stops cited below. Stops were elected below the 37218 and 36837 levels during the retreat lower, downside price objectives related to recent selling pressure around the 37761.93 area. Additional downside price objectives include the 36705, 36528, 36455, 36259, 36164, 36122, 35983, 35624, and 35220 levels.
Following the recent appreciation, areas of technical support and potential buying pressure include the 33499, 32873, 32561, 31351, and 30837 levels. Above the market, significant technical levels linked with historical selling pressure around the 69000 and 48240 areas include the 40503, 41225, and 42230 levels. Traders are observing that the 50-bar MA (4-hourly) is bullishly indicating above the 100-bar MA (4-hourly) and above the 200-bar MA (4-hourly). Also, the 50-bar MA (hourly) is bearishly indicating below the 100-bar MA (hourly) and above the 200-bar MA (hourly).
Price activity is nearest the 50-bar MA (4-hourly) at 37239.33 and the 200-bar MA (Hourly) at 37216.77.
Technical Support is expected around 31238.97/ 30028.62/ 28818.26 with Stops expected below.
Technical Resistance is expected around 38584.16/ 39596.82/ 42721.31 with Stops expected above.
On 4-Hourly chart, SlowK is Bullishly above SlowD while MACD is Bearishly below MACDAverage.
On 60-minute chart, SlowK is Bullishly above SlowD while MACD is Bullishly above MACDAverage.
Sally Ho’s Technical Analysis
View Yesterday’s Trading Analysis
Disclaimer: Sally Ho’s Technical Analysis is provided by a third party, and for informational purposes only. It does not reflect the views of Crypto Daily, nor is it intended to be used as legal, tax, investment, or financial advice.

Related Stories