Bitcoin (BTC) Price Analysis: Technicals at 34732 Challenge Upside – 2 November 2023
Bitcoin (BTC) Price Analysis: Technicals at 34732 Challenge Upside – 2 November 2023
Bitcoin (BTC/USD) was slightly on the defensive early in the Asian session as the pair continued to trade sideways after trading as high as the 34732.18 level, representing a test of the 76.4% retracement of the depreciating range from 35144 to 33400. Selling pressure twice intensified around the 34507 area, right around the 38.2% retracement of the appreciating range from 34038.79 to 34732.18. BTC/USD realized gains around 27% in October and is up approximately 108% year-to-date. Recent selling pressure around the 34871 area was near an upside price objective related to recent buying pressure around the 33000 and 33400 areas. Stops were recently elected above a series of upside price objectives including the 33819, 33755, 34826, and 35035 levels, and major Stops were also elected above the 34190.77 area during the appreciation, a previous downside price objective related to historical selling pressure around the all-time high of 69000 and 59249 levels.
Technically, the recent multi-month high around the 35157 area represented a test of an upside price objective around the 35035 area that is related to recent upward activity around the 29328 and 32525 levels. Additional upside price objectives include the 35718, 35982, 36115, 36541, 36798, 37239, 37890, 38409, 38561, 38584, 39636, 40549, 40743, 40837, 41402, 43841, 43860, and 44269 levels. Following the surge higher, areas of technical support and potential buying pressure include the 32992, 31652, 31238, 30570, 30028, and 29488 levels. Traders are observing that the 50-bar MA (4-hourly) is bullishly indicating above the 100-bar MA (4-hourly) and above the 200-bar MA (4-hourly). Also, the 50-bar MA (hourly) is bullishly indicating above the 100-bar MA (hourly) and above the 200-bar MA (hourly).
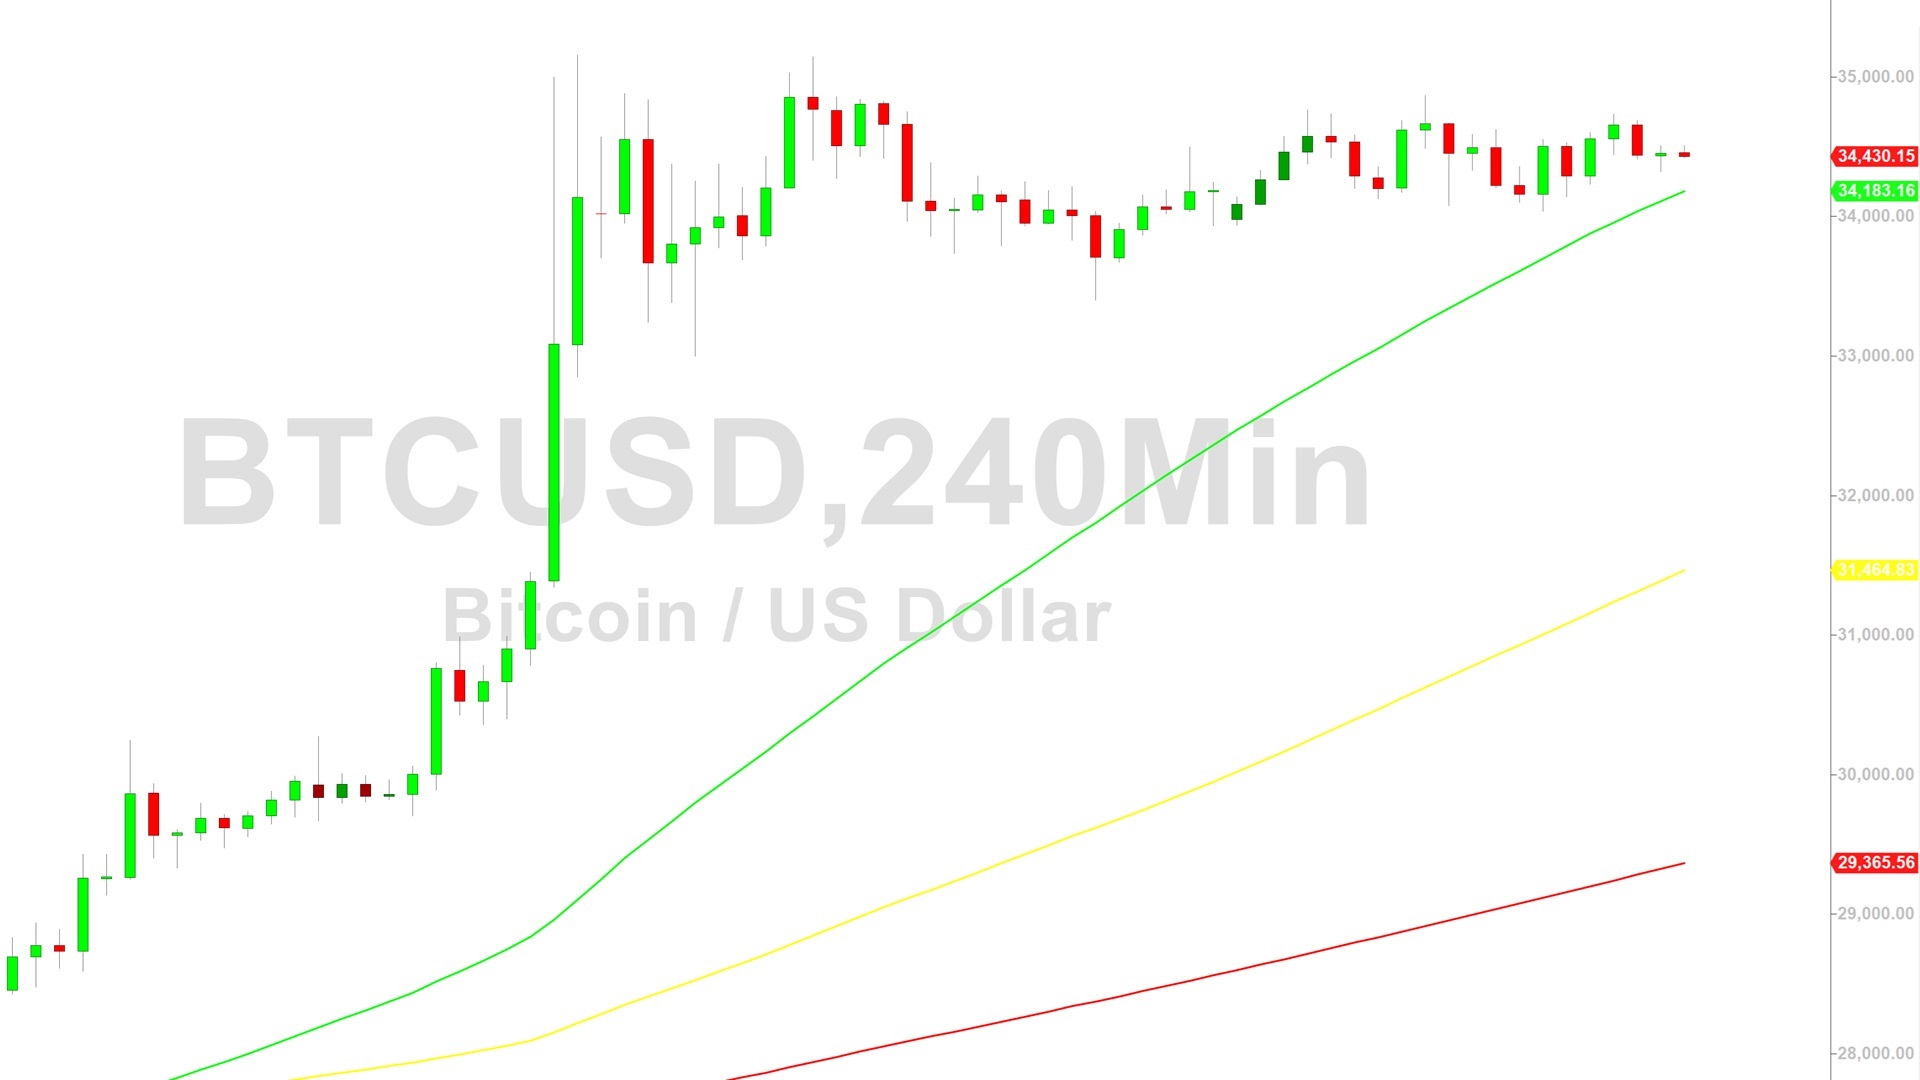
Price activity is nearest the 50-bar MA (4-hourly) at 34183.51 and the 50-bar MA (Hourly) at 34451.07.
Technical Support is expected around 31238.97/ 30028.62/ 28818.26 with Stops expected below.
Technical Resistance is expected around 36541.57/ 37239.15/ 38584.16 with Stops expected above.
On 4-Hourly chart, SlowK is Bullishly above SlowD while MACD is Bearishly below MACDAverage.
On 60-minute chart, SlowK is Bearishly below SlowD while MACD is Bullishly above MACDAverage.
Sally Ho’s Technical Analysis
View Yesterday’s Trading Analysis
Disclaimer: Sally Ho’s Technical Analysis is provided by a third party, and for informational purposes only. It does not reflect the views of Crypto Daily, nor is it intended to be used as legal, tax, investment, or financial advice.

Related Stories