Bitcoin Price Analysis: Building a Base Below 26285 – 14 September 2023
Bitcoin Price Analysis: Building a Base Below 26285 – 14 September 2023
Bitcoin (BTC/USD) sought to resume its recent upward trajectory early in the Asian session as the pair encountered some upward pressure around the 25763.43 level and reached the 26263.90 area, representing a test of a downward price objective related to selling pressure around the 28184.89 and 27576.99 levels. Traders also tested the 26285 area before reversing course, a previous downward price objective related to downside pressure around the 30222 and 28184.89 areas. Traders recently pushed BTC/USD as low as the 24900 area after Stops were elected below a related downside price objective around the 25106.61 area, but bears failed to sustain the downward break. A sustained break below the 25462.40 level will elevate bearish pressure as it is a downward price objective corresponding to significant recent selling pressure around the 28184.89 area.
Stops are cited below the 24197.68 level, a downside price objective related to selling pressure around the 30222 area. Additional price objectives below the market include the 24511, 24339, 23164, 22949, 21496, and 20702 areas. Technical support and potential buying pressure in appreciating ranges from the 15460 and 19568.52 levels include the 23661, 22793, and 21725 levels. Some Stops are cited above the 26764, 27099, and 27576 areas. Traders are observing that the 50-bar MA (4-hourly) is bearishly indicating below the 100-bar MA (4-hourly) and below the 200-bar MA (4-hourly). Also, the 50-bar MA (hourly) is bearishly indicating below the 100-bar MA (hourly) and below the 200-bar MA (hourly).
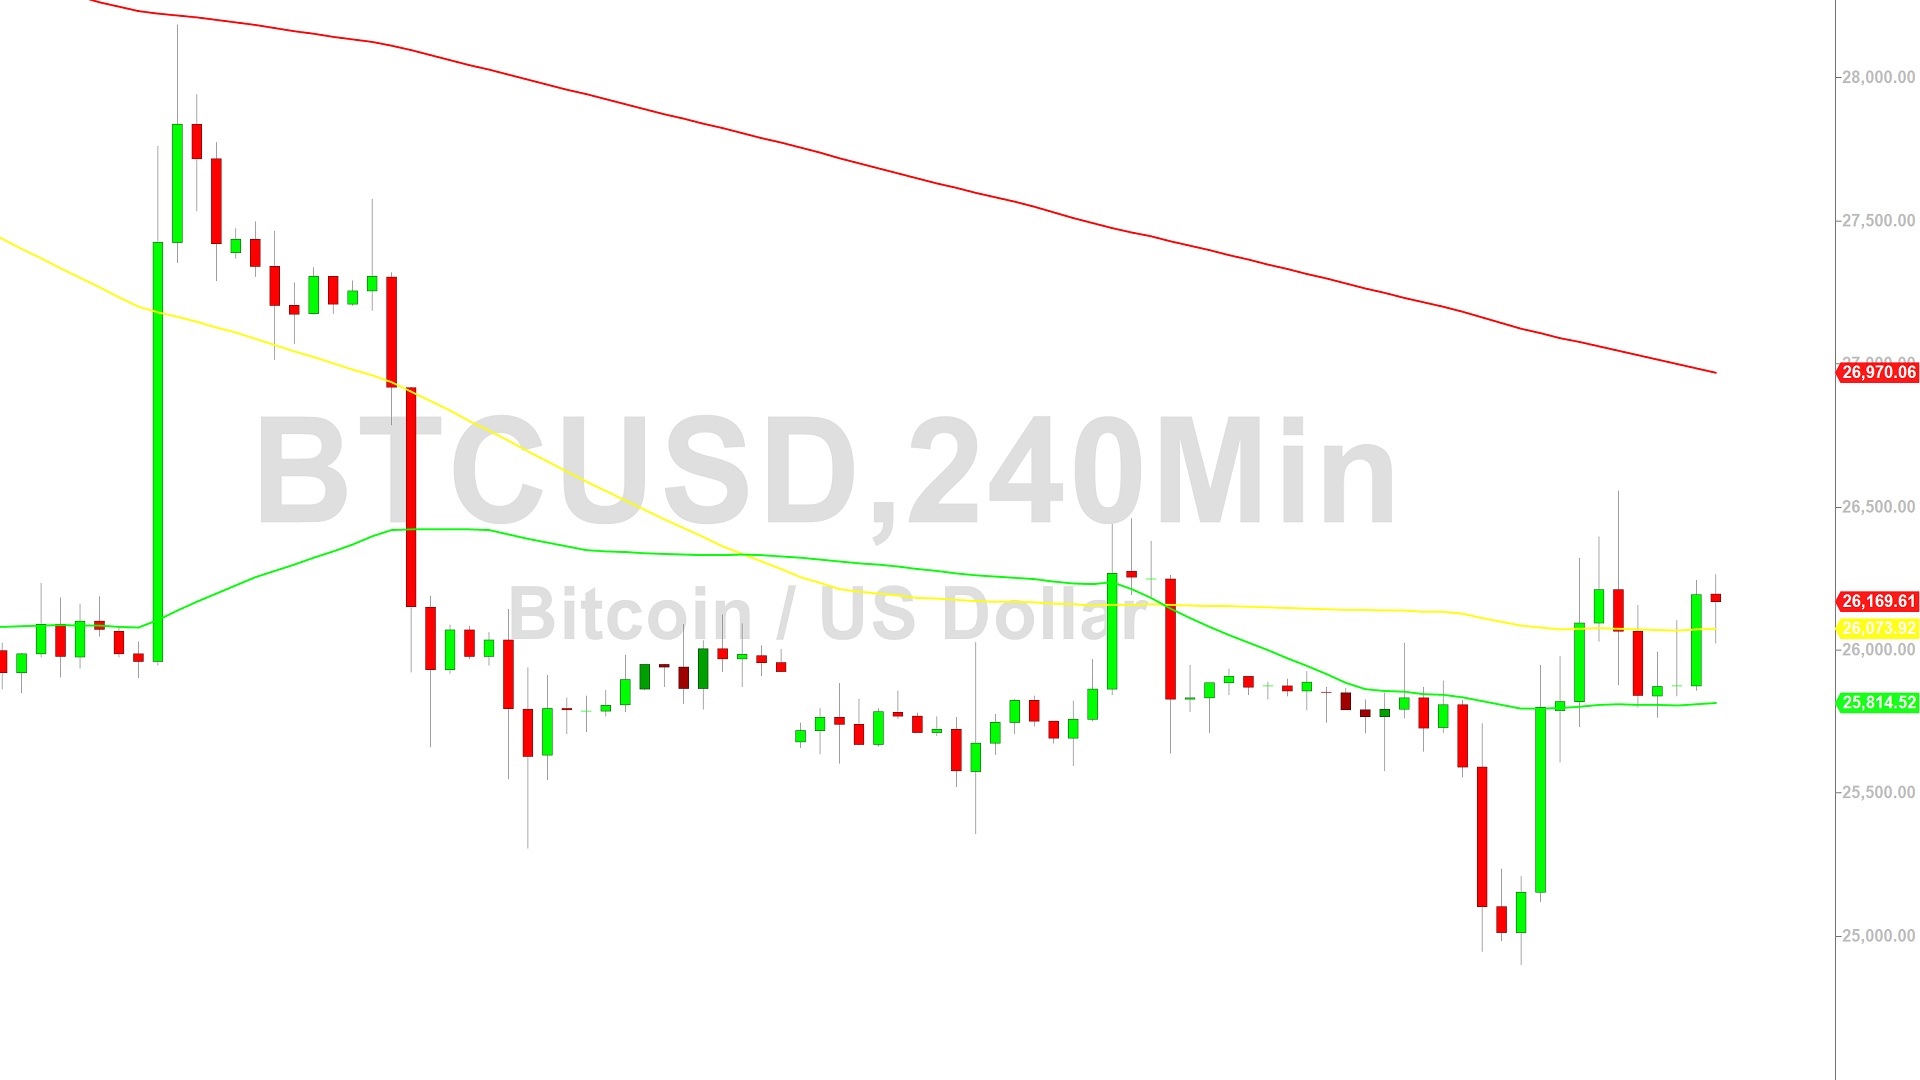
Price activity is nearest the 100-bar MA (4-hourly) at 26073.63 and the 200-bar MA (Hourly) at 25811.73.
Technical Support is expected around 24440.41/ 23270.10/ 22769.39 with Stops expected below.
Technical Resistance is expected around 31986.16/ 32989.19/ 34658.69 with Stops expected above.
On 4-Hourly chart, SlowK is Bullishly above SlowD while MACD is Bullishly above MACDAverage.
On 60-minute chart, SlowK is Bearishly below SlowD while MACD is Bullishly above MACDAverage.
Sally Ho’s Technical Analysis
View Yesterday’s Trading Analysis
Disclaimer: Sally Ho’s Technical Analysis is provided by a third party, and for informational purposes only. It does not reflect the views of Crypto Daily, nor is it intended to be used as legal, tax, investment, or financial advice.

Related Stories