BTC/USD Bulls Eyeing 27436: Sally Ho’s Technical Analysis – 25 August 2023
BTC/USD Bulls Eyeing 27436: Sally Ho’s Technical Analysis – 25 August 2023
Bitcoin (BTC/USD) attempted to maintain a bid early in the Asian session as the pair awaited technical guidance following recent upward pressure that strengthened around the 25350 and 25796.47 levels and continued until the 26818.28 area. Related upside price objectives include the 26944.02 and 27436.41 areas. Stops were elected above the 28778.57 area during the ascent, a level that represents the 50% retracement of the depreciating range from 31862.21 to 21694.92. Areas of technical support and potential buying pressure in appreciating ranges from the 15460 and 19568.52 levels include the 23661, 22793, and 21725 levels. Following recent selling pressure, areas of technical resistance and potential selling pressure include the 26798, 27139, 27728, 27766, 28316, 28548, 29154, 29330, and 30443 levels.
The recent fresh multi-month low around the 25234.76 area represented a test of a major downside price objective around the 25128.94 area that is associated with selling pressure that increased around the 31862.21 and 30421.29 levels in July. Major Stops were elected below the 27991.29 and 27620.46 areas during the recent depreciation, downside price objectives linked to recent selling pressure around the 31862.21, 30222 and 29665.27 areas. Above the market, upside price objectives include the 30526, 30611, 30762, and 31145 areas. Upside price objectives related to other levels of buying pressure include the 32125 and 33569 areas, and Stops are cited above additional upside price objectives around the 32043, 34531, 34658, and 35912 areas. Traders are observing that the 50-bar MA (4-hourly) is bearishly indicating below the 100-bar MA (4-hourly) and below the 200-bar MA (4-hourly). Also, the 50-bar MA (hourly) is bearishly indicating below the 200-bar MA (hourly) and above the 100-bar MA (hourly).
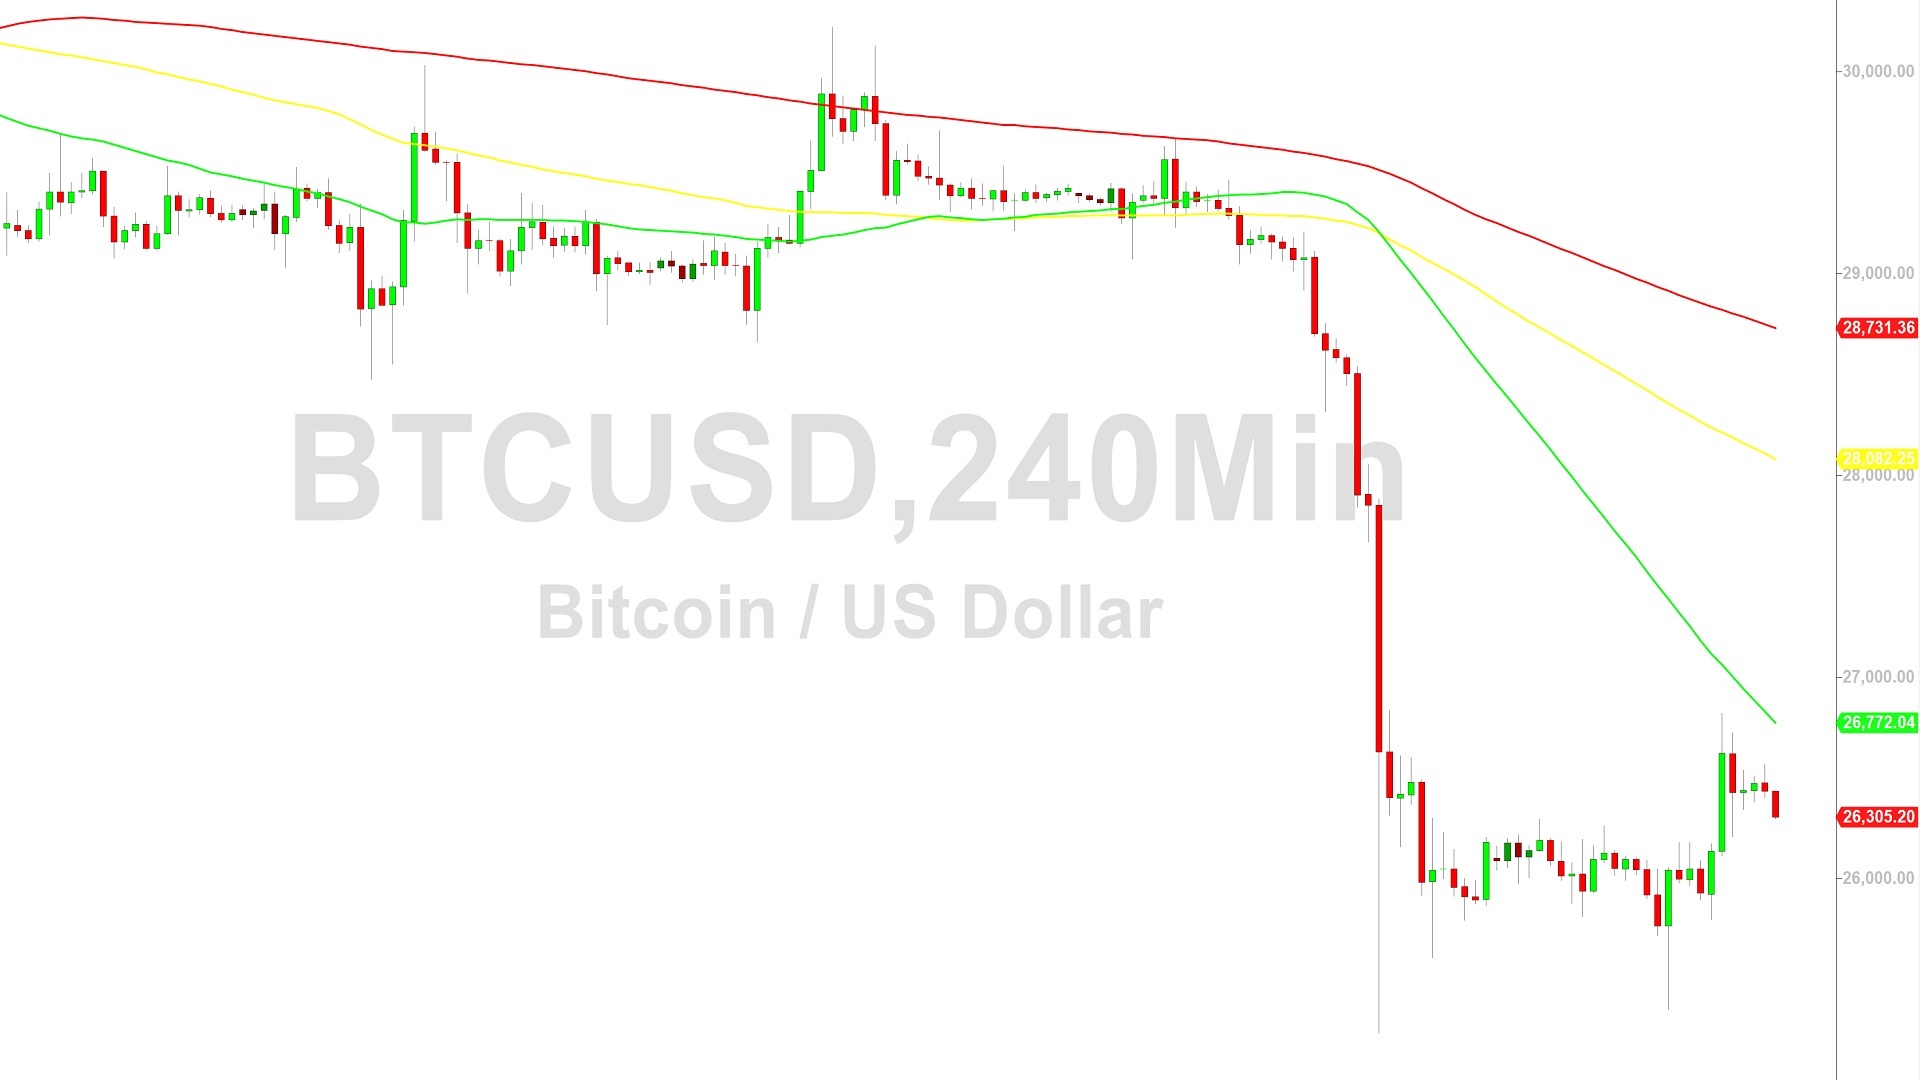
Price activity is nearest the 50-bar MA (4-hourly) at 26773.09 and the 50-bar MA (Hourly) at 26175.47.
Technical Support is expected around 24440.41/ 23270.10/ 22769.39 with Stops expected below.
Technical Resistance is expected around 31986.16/ 32989.19/ 34658.69 with Stops expected above.
On 4-Hourly chart, SlowK is Bearishly below SlowD while MACD is Bullishly above MACDAverage.
On 60-minute chart, SlowK is Bearishly below SlowD while MACD is Bearishly below MACDAverage.
View Yesterday’s Trading Analysis
Disclaimer: Sally Ho’s Technical Analysis is provided by a third party, and for informational purposes only. It does not reflect the views of Crypto Daily, nor is it intended to be used as legal, tax, investment, or financial advice.

Related Stories