Bitcoin Price Analysis: Tight Range Tightens - 14 August 2023
BTC/USD Orbiting 29403: Sally Ho’s Technical Analysis – 14 August 2023
Bitcoin (BTC/USD) awaited a new technical bias early in the Asian session as the pair orbited the 29403.79 area, representing a downside price objective associated with recent selling pressure around the 30421 and 29851 levels. Selling pressure has recently strengthened around the 29709 and 29534 areas while buying pressure emerged around the 29213 area, underscoring the recent tight range. Technical trading was recently evident when buying pressure strengthened around the 28754 area, a previous downside price objective associated with selling pressure around the 29526 and 29344 areas. Large Stops are cited below the 27991.29 area, representing the 23.6% retracement of the broader appreciating range from 15460 to 31862.21. Additional areas of technical support and potential buying pressure in these appreciating ranges include the 27466, 27166, 26428, 26272, and 25715 areas.
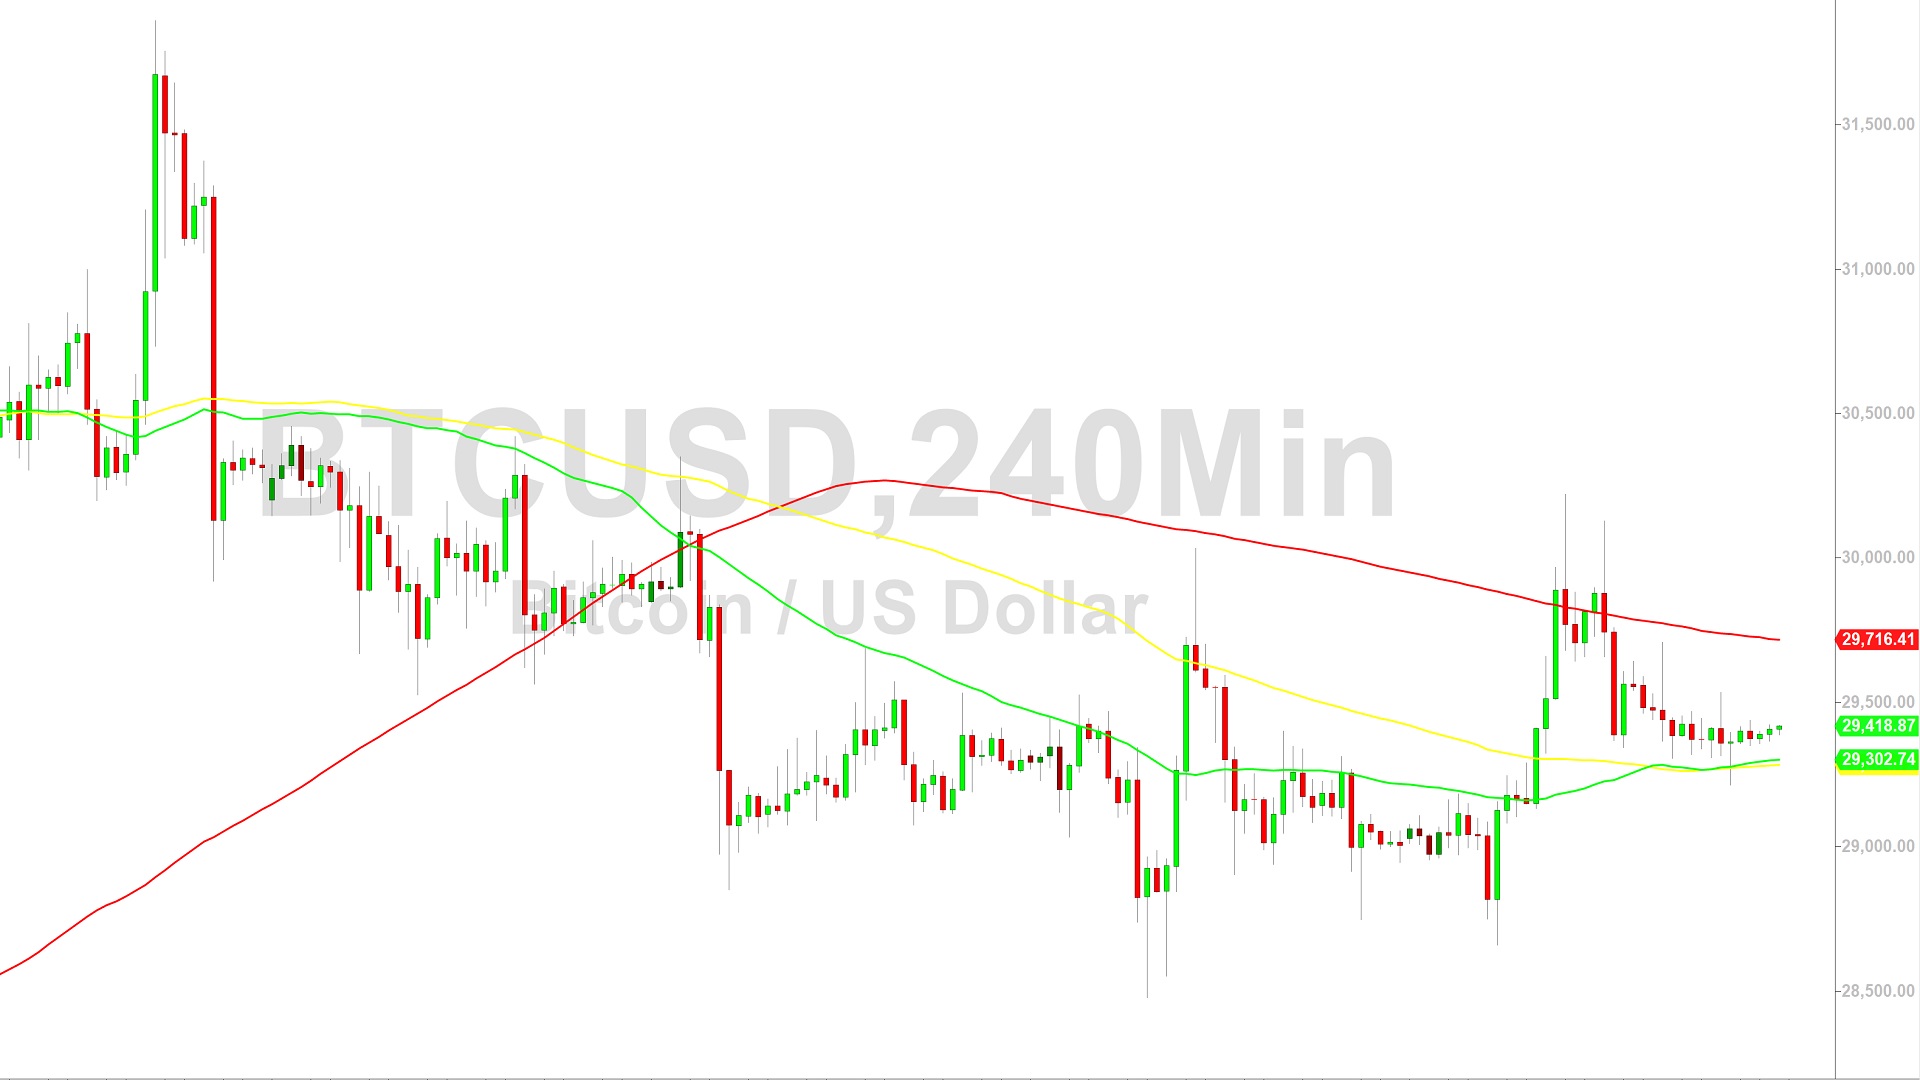
Above the market, upside price objectives include the 30526, 30611, 30762, and 31145 areas. Upside price objectives related to other levels of buying pressure include the 32125 and 33569 areas, and Stops are cited above additional upside price objectives around the 32043, 34531, 34658, and 35912 areas. Additional downside price objectives linked to recent selling pressure include the 28432, 28213, 28137, 27979, 27757, 27430, 27409, 27338, 27312, 27246, 26501, 26348, and 26199 levels. Also, the 28095.44 area represents the 23.6% retracement of the historic depreciating range from 69000 to 15460. Traders are observing that the 50-bar MA (4-hourly) is bearishly indicating below the 200-bar MA (4-hourly) and above the 100-bar MA (4-hourly). Also, the 50-bar MA (hourly) is bearishly indicating below the 100-bar MA (hourly) and above the 200-bar MA (hourly).
Price activity is nearest the 50-bar MA (4-hourly) at 29302.77 and the 50-bar MA (Hourly) at 29398.79.
Technical Support is expected around 24440.41/ 23270.10/ 22769.39 with Stops expected below.
Technical Resistance is expected around 31986.16/ 32989.19/ 34658.69 with Stops expected above.
On 4-Hourly chart, SlowK is Bullishly above SlowD while MACD is Bearishly below MACDAverage.
On 60-minute chart, SlowK is Bearishly below SlowD while MACD is Bullishly above MACDAverage.
Disclaimer: Sally Ho’s Technical Analysis is provided by a third party, and for informational purposes only. It does not reflect the views of Crypto Daily, nor is it intended to be used as legal, tax, investment, or financial advice.

Related Stories