Bitcoin Price Analysis: 31525 Peak Then Volatility - 7 July 2023
BTC/USD Bulls Stampede to 31525 Before Volatility: Sally Ho’s Technical Analysis – 7 July 2023
Bitcoin (BTC/USD) attempted to retain recent strong advances early in the Asian session as the pair was lifted to the 31525.10 area, a fresh twelve-month high, after Stops were elected above the 31443.67 area that had represented a recently-established yearly high. Buying pressure emerged around the 30328.79 area and follow-on technical activity around the 30439.66 and 30575.66 areas accelerated the move. During a volatile pullback, buying pressure initially emerged around the 31828 level, a move lower to test the 38.2% retracement of the recent appreciating range from 30189.56 to 31525.10. Stops were eventually elected below the 31014, 30857, and 30699 areas during the eventual profit-taking depreciation, and additional downside retracement levels include the 30504 and 30475 areas.
Above the market, additional upside price objectives include the 31737, 32125, and 33569 areas. Stops are cited above additional upside price objectives around the 31674, 32043, 34531, and 34658 areas.
Following recent activity, areas of potential technical support and buying pressure include the 29863, 29427, 28886, 28804, 28182, 28096, and 27306 areas. Technicians are closely watching to see how much technical support develops around the 28095.44 area, representing the 23.6% retracement of the historical depreciating range from 69000 to 15460. Traders are observing that the 50-bar MA (4-hourly) is bullishly indicating above the 100-bar MA (4-hourly) and above the 200-bar MA (4-hourly). Also, the 50-bar MA (hourly) is bearishly indicating below the 100-bar MA (hourly) and above the 200-bar MA (hourly).
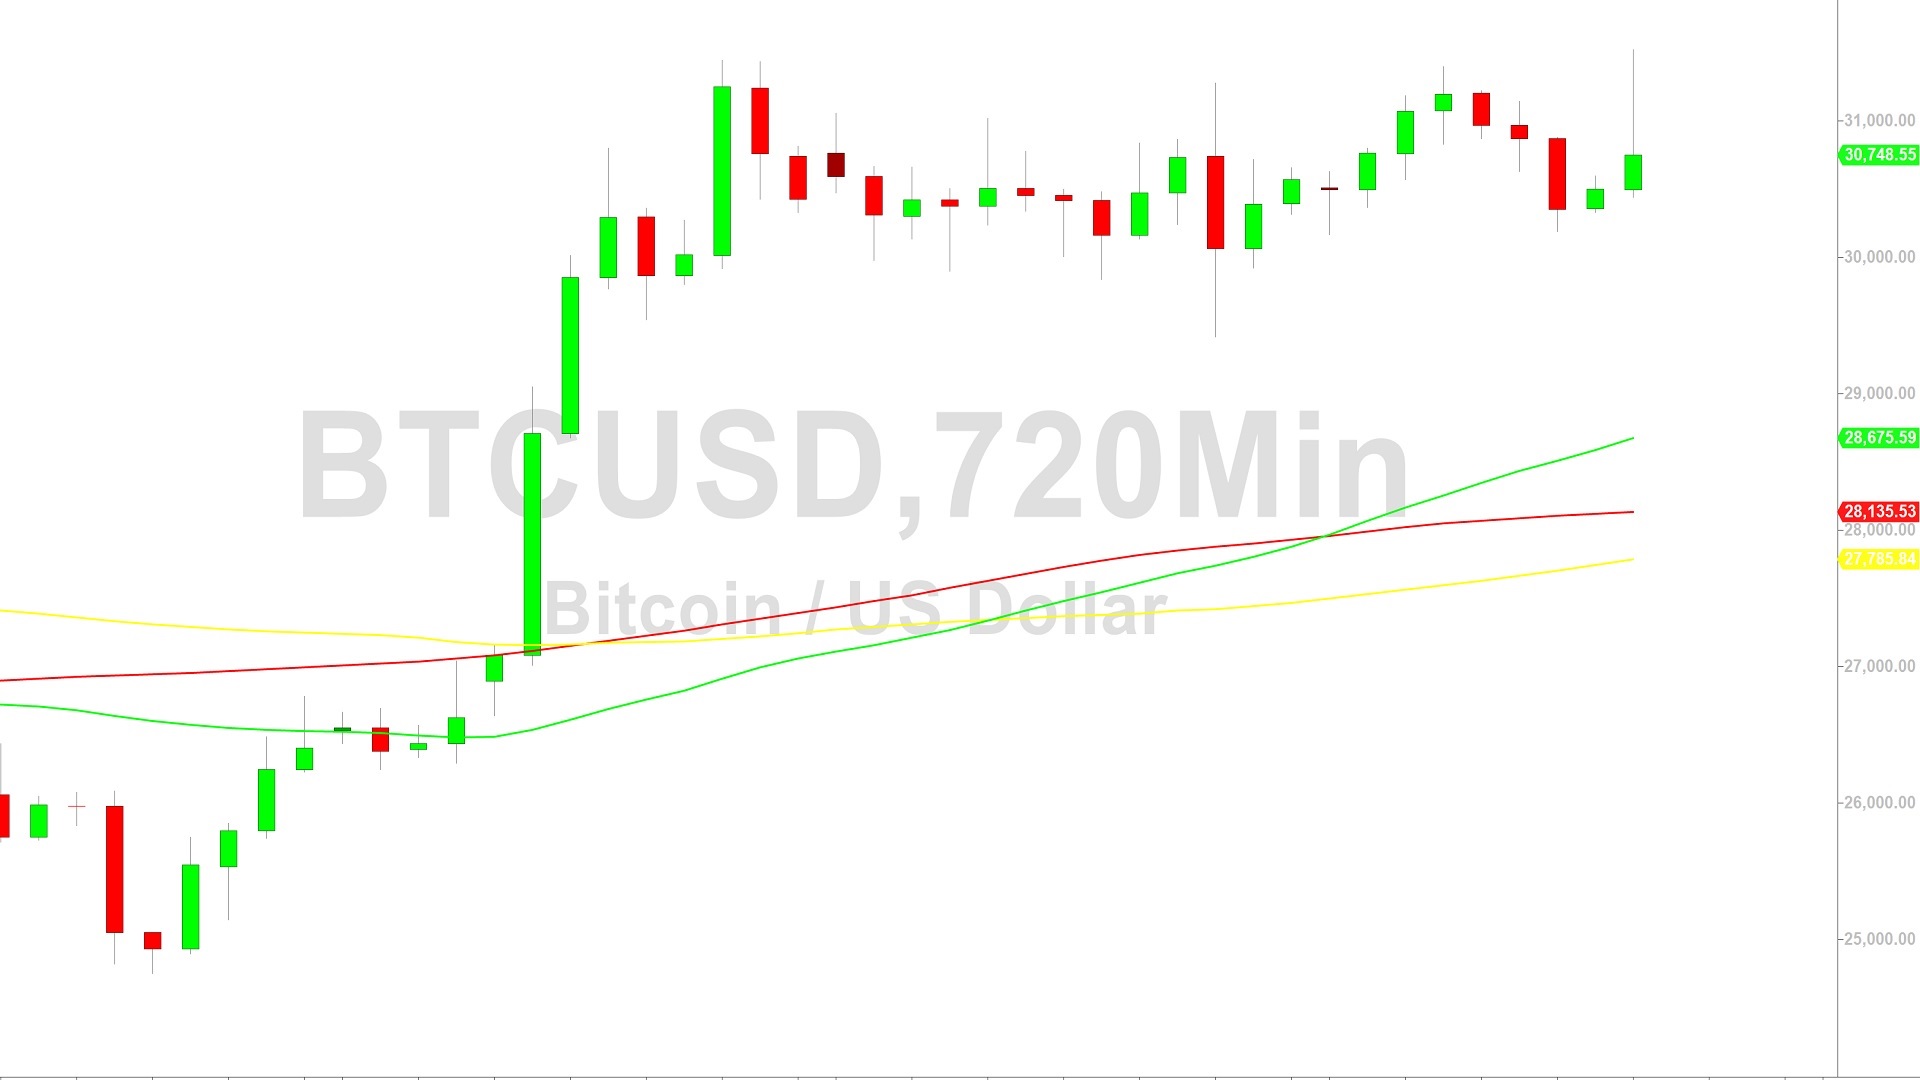
Price activity is nearest the 50-bar MA (4-hourly) at 30604.81 and the 50-bar MA (Hourly) at 30714.61.
Technical Support is expected around 24440.41/ 23270.10/ 22769.39 with Stops expected below.
Technical Resistance is expected around 31986.16/ 32989.19/ 34658.69 with Stops expected above.
On 4-Hourly chart, SlowK is Bullishly above SlowD while MACD is Bearishly below MACDAverage.
On 60-minute chart, SlowK is Bearishly below SlowD while MACD is Bullishly above MACDAverage.
Disclaimer: Sally Ho’s Technical Analysis is provided by a third party, and for informational purposes only. It does not reflect the views of Crypto Daily, nor is it intended to be used as legal, tax, investment, or financial advice.

Related Stories