Bitcoin Price Analysis: 26587 Target Absorbed - 18 June 2023
BTC/USD Absorbs 26587 Target: Sally Ho’s Technical Analysis – 18 June 2023
Bitcoin (BTC/USD) extended recent gains early in the Asian session as the pair reached the 26783.20 area after Stops were elected above the 26611.97 area, representing the 50% retracement of the recent depreciating range from 28473.93 to 24750. Additional upside retracement levels in this depreciating range include the 27051, 27595, and 27677 areas. Significant Stops were also elected above the 26587.57 area during the climb, an upside price objective associated with buying pressure that emerged around the 24750 and 25143.24 areas. The technical significance of these levels was confirmed when buying pressure emerged around the 26165 area during a pullback, just above another upside price objective around the 26153 area. Below the market, downside price objectives include the 25323.24 and 24680.87 levels. Stops are also cited below major retracement levels linked to the 19568.52 and 15460 levels, including the 25094, 23954, 23255, 22278, and 22025 areas.
Additional downside price objectives include the 24440, 23208, and 22769 levels. Following recent price activity, areas of technical resistance and potential selling pressure include the 27528, 27737, 27805, 28200, 28473, and 28873 levels. Upside retracement levels in recent depreciating ranges include the 28700, 28741, 28868, 29243, 29299, and 29284 levels. Above the market, upside price objectives include the 30420.74, 31237.11, 31477.37, 32501.23, 32556.73, 32989.19, 34583.96, 34658.69, 35222.66, 37765.28, and 38403.97 levels. Traders are observing that the 50-bar MA (4-hourly) is bearishly indicating below the 100-bar MA (4-hourly) and below the 200-bar MA (4-hourly). Also, the 50-bar MA (hourly) is bearishly indicating below the 200-bar MA (hourly) and above the 100-bar MA (hourly).
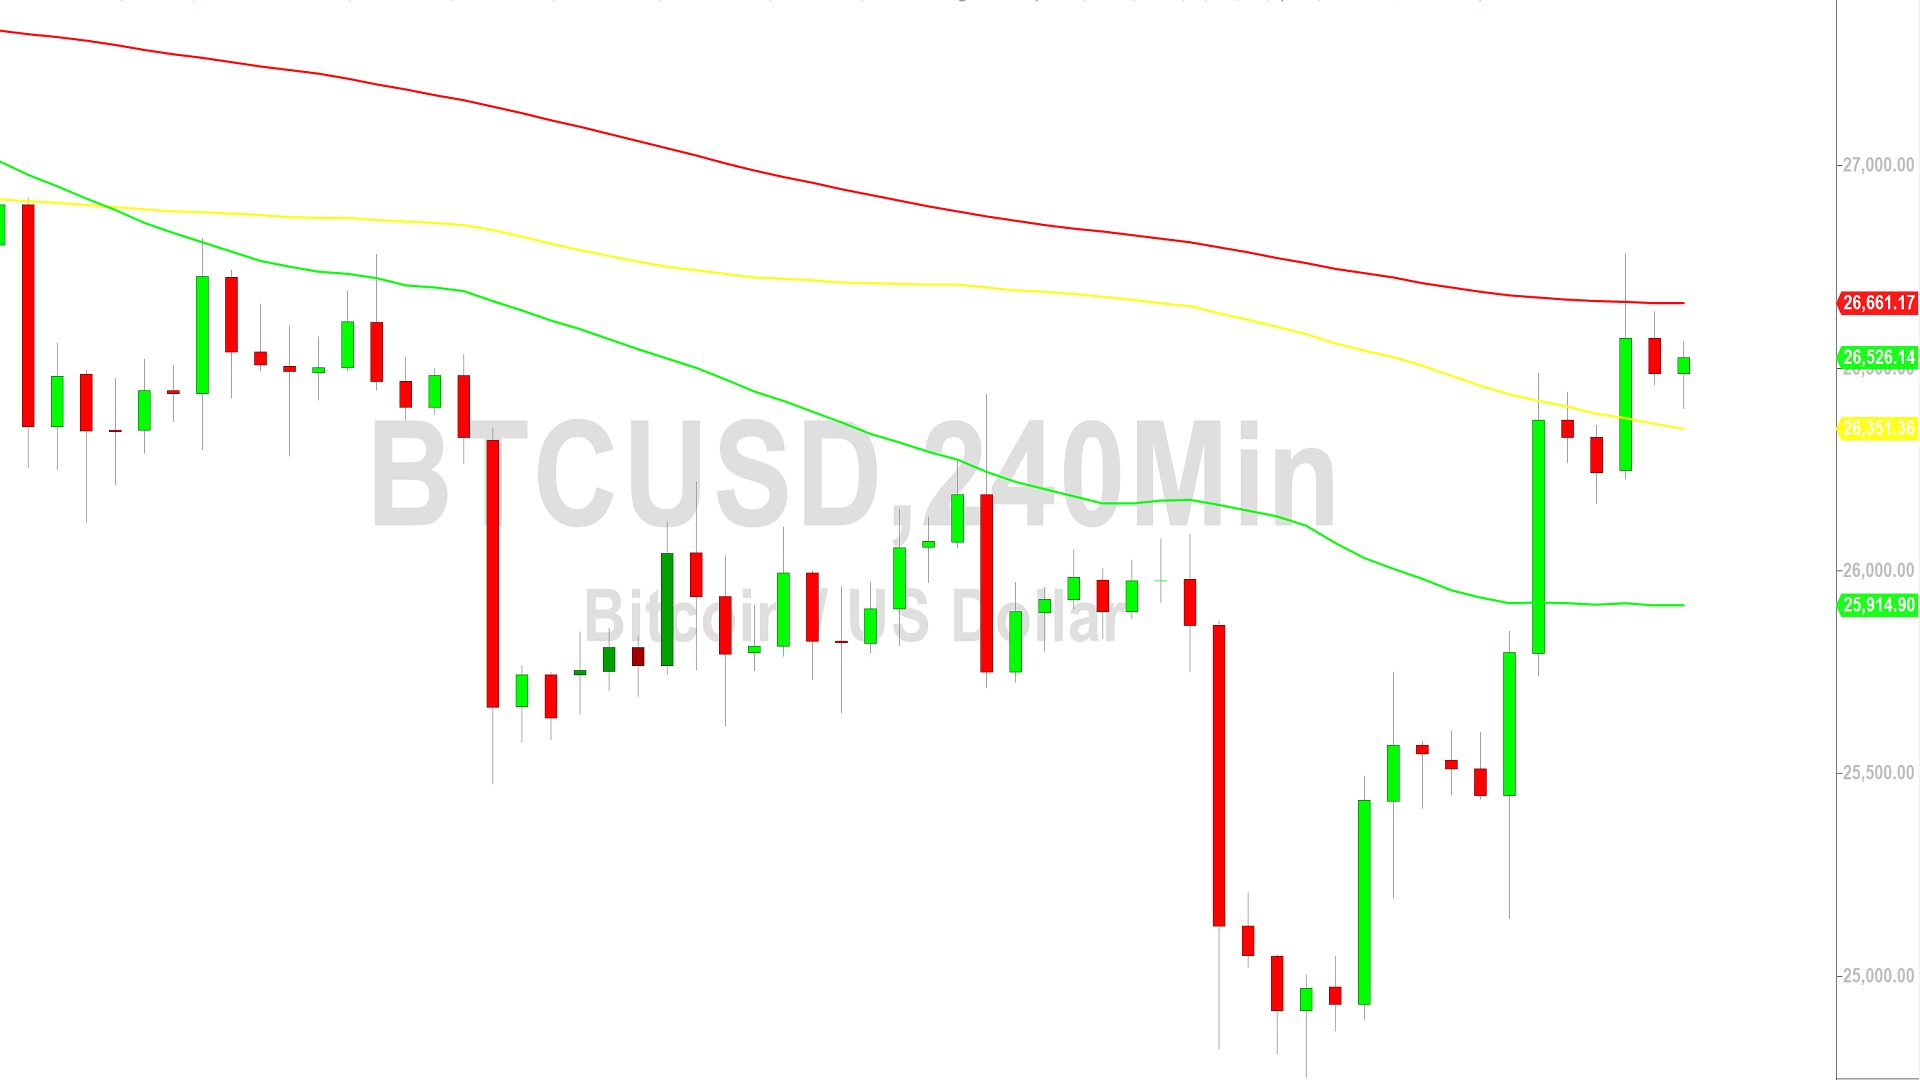
Price activity is nearest the 200-bar MA (4-hourly) at 26661.17 and the 200-bar MA (Hourly) at 25913.83.
Technical Support is expected around 24440.41/ 23270.10/ 22769.39 with Stops expected below.
Technical Resistance is expected around 31986.16/ 32989.19/ 34658.69 with Stops expected above.
On 4-Hourly chart, SlowK is Bearishly below SlowD while MACD is Bullishly above MACDAverage.
On 60-minute chart, SlowK is Bearishly below SlowD while MACD is Bearishly below MACDAverage.
Disclaimer: Sally Ho’s Technical Analysis is provided by a third party, and for informational purposes only. It does not reflect the views of Crypto Daily, nor is it intended to be used as legal, tax, investment, or financial advice.

Related Stories