Bitcoin Price Analysis: Bulls Eyeing 27149 - 28 May 2023
BTC/USD Bulls Eyeing 27149: Sally Ho’s Technical Analysis – 28 May 2023
Bitcoin (BTC/USD) encountered increasingly positive momentum early in the Asian session as the pair awaited additional technical guidance following an ascent to the 26950 level, its strongest print in a few trading sessions. Stops were elected above the 26771.54 and 26875.18 levels during the climb, retracement levels associated with recent selling pressure that intensified around the 27678.73 and 27500 levels. Technical buying pressure has recently been steady around the 26641 area, a downside price objective also linked to the 27678.73 area. Downside price objectives associated with the 28334.75 and 27647.82 levels include the 25604.43 and 25124.80 levels. Additional downside price objectives include the 25474, 25442, 24705, 24440, 23208, and 22769 levels.
Following recent price activity, areas of technical resistance and potential selling pressure include the 26810, 27046, 27429, 27811, 28430, 29048, 29143, and 29813 levels. Upside retracement levels in recent depreciating ranges include the 27981, 28095, 28700, 28741, 28868, 29243, 29299, and 29284 levels. Above the market, upside price objectives include the 30420.74, 31237.11, 31477.37, 32501.23, 32556.73, 32989.19, 34583.96, 34658.69, 35222.66, 37765.28, and 38403.97 levels. Traders are observing that the 50-bar MA (4-hourly) is bearishly indicating below the 100-bar MA (4-hourly) and below the 200-bar MA (4-hourly). Also, the 50-bar MA (hourly) is bearishly indicating below the 100-bar MA (hourly) and below the 200-bar MA (hourly).
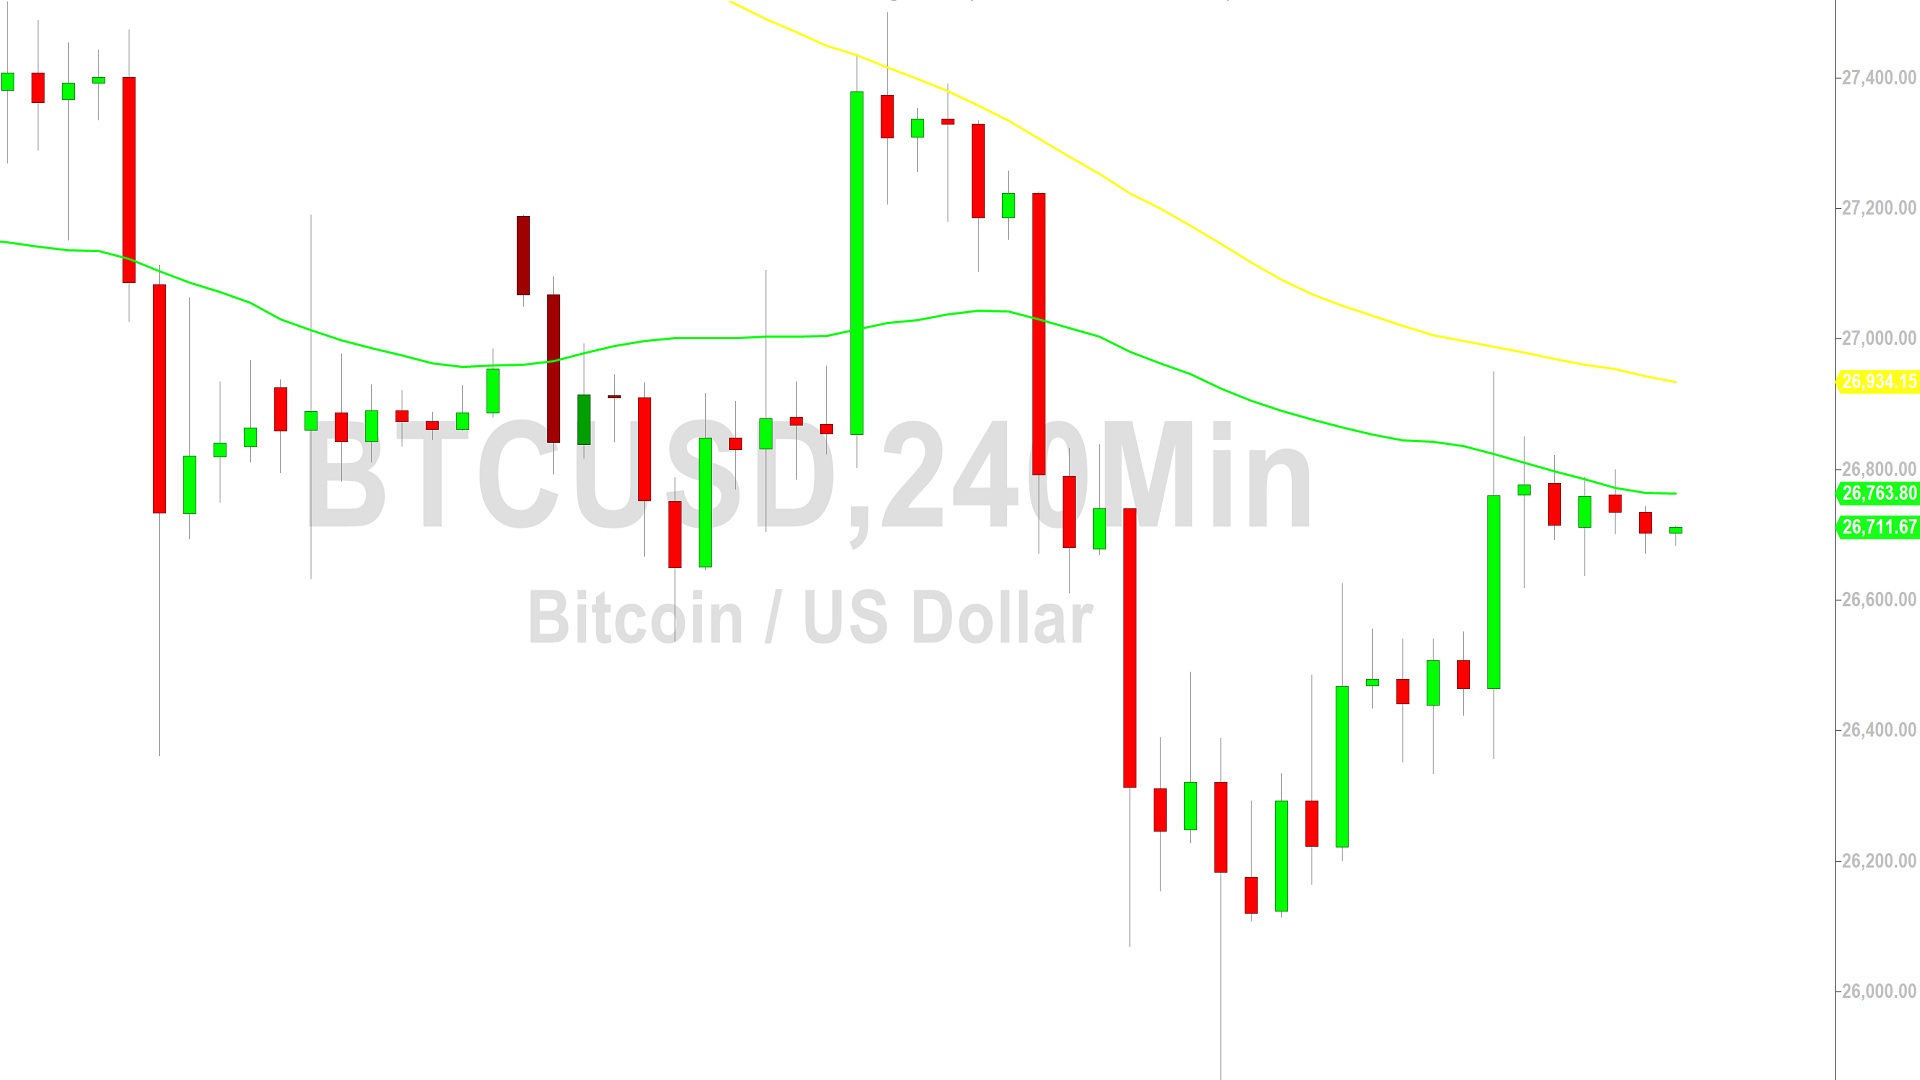
Price activity is nearest the 50-bar MA (4-hourly) at 26763.77 and the 50-bar MA (Hourly) at 26563.67.
Technical Support is expected around 25604.51/ 24440.41/ 22769.39 with Stops expected below.
Technical Resistance is expected around 31986.16/ 32989.19/ 34658.69 with Stops expected above.
On 4-Hourly chart, SlowK is Bearishly below SlowD while MACD is Bullishly above MACDAverage.
On 60-minute chart, SlowK is Bullishly above SlowD while MACD is Bearishly below MACDAverage.
Disclaimer: Sally Ho’s Technical Analysis is provided by a third party, and for informational purposes only. It does not reflect the views of Crypto Daily, nor is it intended to be used as legal, tax, investment, or financial advice.

Related Stories