BTC/USD Upside Momentum Rallies: Sally Ho’s Technical Analysis – 16 December 2022
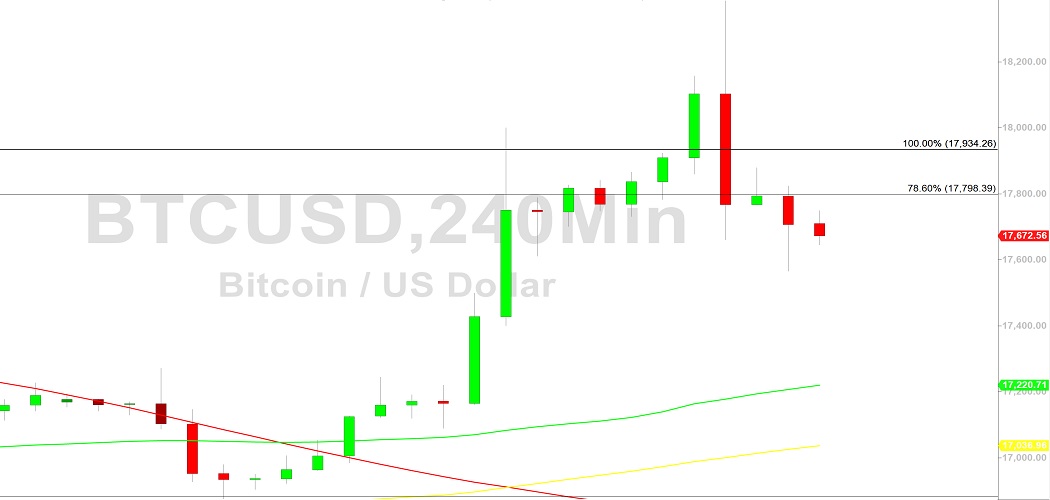
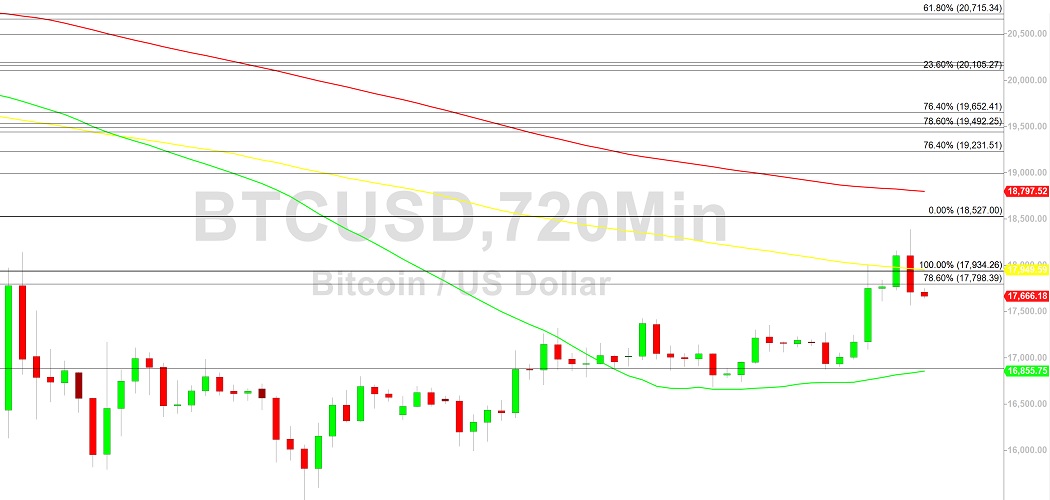
Bitcoin (BTC/USD) sought to reclaim recent upside progress early in the Asian session as the pair moderated after recently peaking around the 18385.36 level, its strongest print since early November. Stops were elected below the 17694.98 level during the pullback, representing the 23.6% retracement of the recent broader appreciating range from 15460 to 18385.36. Additional retracement levels in this appreciating range include the 17267.87, 16922.68, 16577.49, 16150.38, and 16086.03. Risk aversion has been reduced in recent days and traders have been able to propel BTC/USD to multi-week highs after Stops were elected above the 17779.81 and 17872.75 levels. Additional technically significant upside retracement levels include the 18495, 19199, 20070, and 20201 levels. Following recent gains from two-year lows around the 15460 area, areas of potential technical support and buying pressure include the 17400.55, 17029.71, 16730, 16430.28, 16059.44, and 16003.56 areas.
Below current price activity, BTC/USD bears are eyeing a possible test of recent two-year lows around the 15460 area, established after Stops were elected below the 15512 area. Notably, the 15512 level represented an exact bearish price objective based on selling pressure that strengthened around the 21478.80 and 18495.50 areas. Below these areas, technically significant levels include the 14613, 14500.15, 13369, 10432.73, 10727, 9682, 8837, and 7538 levels. Traders are observing that the 50-bar MA (4-hourly) is bullishly indicating above the 200-bar MA (4-hourly) and above the 200-bar MA (4-hourly). Also, the 50-bar MA (hourly) is bullishly indicating above the 100-bar MA (hourly) and above the 200-bar MA (hourly).
Price activity is nearest the 50-bar MA (4-hourly) at 17220.71 and the 50-bar MA (Hourly) at 17757.07.
Technical Support is expected around 14500.15/ 13369.11/ 10727.75 with Stops expected below.
Technical Resistance is expected around 18495.40/ 19199.48/ 20070.64 with Stops expected above.
On 4-Hourly chart, SlowK is Bearishly below SlowD while MACD is Bullishly above MACDAverage.
On 60-minute chart, SlowK is Bearishly below SlowD while MACD is Bearishly below MACDAverage.
Disclaimer: Sally Ho’s Technical Analysis is provided by a third party, and for informational purposes only. It does not reflect the views of Crypto Daily, nor is it intended to be used as legal, tax, investment, or financial advice.