BTC/USD Remains Challenged: Sally Ho’s Technical Analysis – 19 September 2022
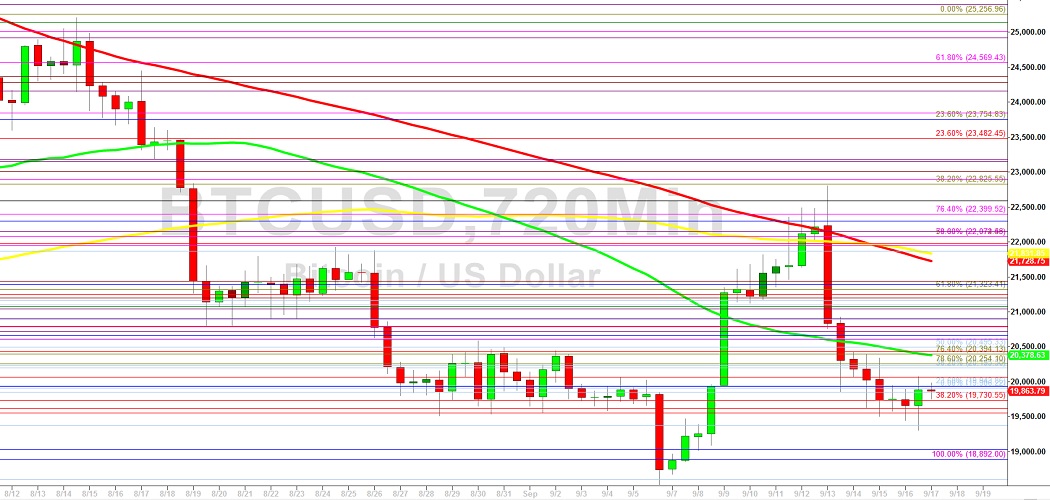
Bitcoin (BTC/USD) continued to remain challenged early in the Asian session as the pair orbited the psychologically-important 20000 figure after recently finding buying pressure around the 19305 area, just below the 23.6% retracement of the depreciating range from 21870.03 to 18607.03. Following the recent sharp decline, the 20433 area has emerged as an area of consistent technical resistance and is technically related to selling pressure that commenced around the all-time high of 69000. Stops were elected below the 21870.79 and 21081.65 levels during the recent sharp descent. Above recent price activity, upside retracement levels in the depreciating range from 31549.21 to 17567.45 include the 26208, 28249, and 28557 areas. Additional upside price objectives and areas of potential selling pressure include the 25552, 26323, 26411, 26901, 27126, 27455, 28426, and 29669 areas.
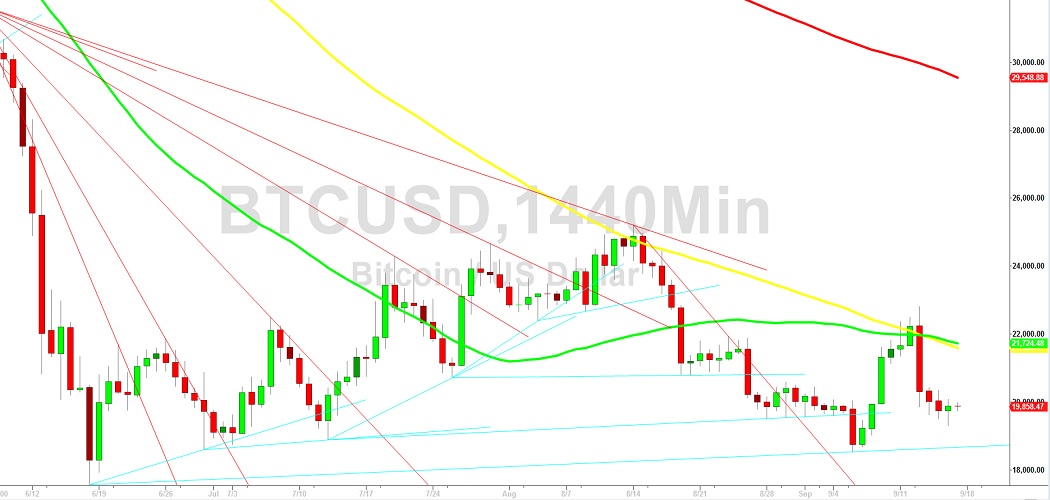
BTC/USD failed to sustain a short-lived break above the 24558.33 level during the month of August, an area that represents the 50% of the depreciating range from 31549.21 to 17567.45. Below current price activity. traders continue to anticipate large Stops below the 17803, 17701, 16966, and 16503 areas, significant technical levels related to historical upside pressure around the 3858 and 9819 areas. Following the recent selling pressure, additional significant technical areas on the downside include the 16990.14, 14500.15, and 10432.73 areas. Traders are observing that the 50-bar MA (4-hourly) is bearishly indicating below the 200-bar MA (4-hourly) and above the 100-bar MA (4-hourly). Also, the 50-bar MA (hourly) is bearishly indicating below the 100-bar MA (hourly) and below the 200-bar MA (hourly).
Price activity is nearest the 100-bar MA (4-hourly) at 20288.47 and the 50-bar MA (Hourly) at 19786.12.
Technical Support is expected around 16990.14/ 14500.15/ 10432.73 with Stops expected below.
Technical Resistance is expected around 25256.96/ 27455.20/ 32383.96 with Stops expected above.
On 4-Hourly chart, SlowK is Bullishly above SlowD while MACD is Bearishly below MACDAverage.
On 60-minute chart, SlowK is Bearishly below SlowD while MACD is Bullishly above MACDAverage.
Disclaimer: Sally Ho’s Technical Analysis is provided by a third party, and for informational purposes only. It does not reflect the views of Crypto Daily, nor is it intended to be used as legal, tax, investment, or financial advice.