Bitcoin (BTC/USD) continued to suffer from negative technical sentiment early in the Asian session as the pair tried to recover after trading as low as the 19875 area, representing a test of the 38.2% retracement of the appreciating range from 17567.45 to 21711. Bids later emerged around the 20270 level, representing the 50% retracement of the depreciating range from 22974.10 to 17567.45. The recent move lower to the 19751 area represented a test of the 38.2% retracement of the depreciating range from 22974.10 to 17567.45. Stops were also recently elected below the 20195.33 area during the recent depreciation, a downside price objective related to selling pressure that intensified around the 52100 area.
If BTC/USD extends its ongoing pullback, additional downside price objectives include the 16990, 15502, and 14500 areas. BTC/USD has now depreciated more than 34% from the beginning of the month through its month-to-date technical trough, and the pair has now slumped more than 55% year-to-date and more than 66% from its all-time high. Technical resistance levels and areas of potential selling pressure include the 22908, 24558, 26208, 28249, and 28557 areas. Stronger technical resistance is evident around the 27288 area, with Stops likely in place above this area. Traders are observing that the 50-bar MA (4-hourly) is bearishly indicating below the 100-bar MA (4-hourly) and below the 200-bar MA (4-hourly). Also, the 50-bar MA (hourly) is bearishly indicating below the 100-bar MA (hourly) and below the 200-bar MA (hourly).
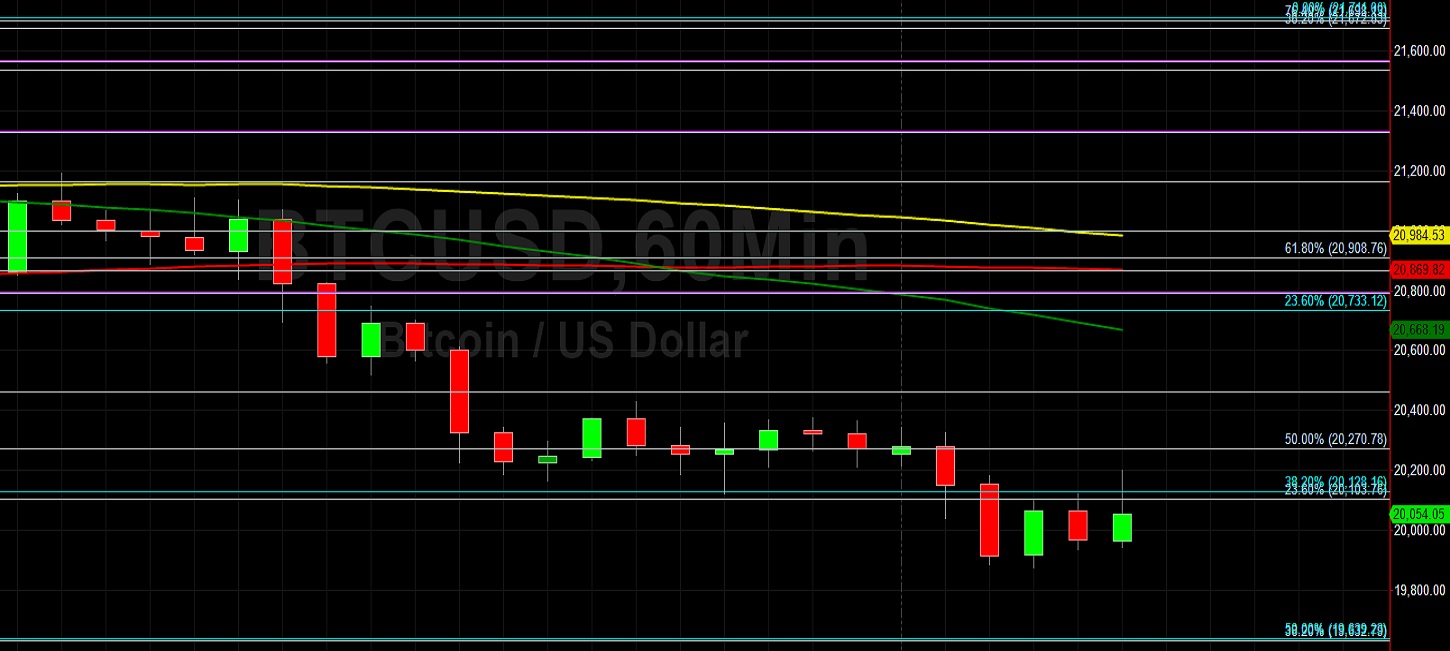
Price activity is nearest the 50-bar MA (4-hourly) at 20850.81 and the 50-bar MA (Hourly) at 20806.65.
Technical Support is expected around 16990.14/ 14500.15/ 10432.73 with Stops expected below.
Technical Resistance is expected around 24365.11/ 27455.20/ 32383.96 with Stops expected above.
On 4-Hourly chart, SlowK is Bearishly below SlowD while MACD is Bearishly below MACDAverage.
On 60-minute chart, SlowK is Bullishly above SlowD while MACD is Bearishly below MACDAverage.
Disclaimer: This trading analysis is provided by a third party, and for informational purposes only. It does not reflect the views of Crypto Daily, nor is it intended to be used as legal, tax, investment, or financial advice.