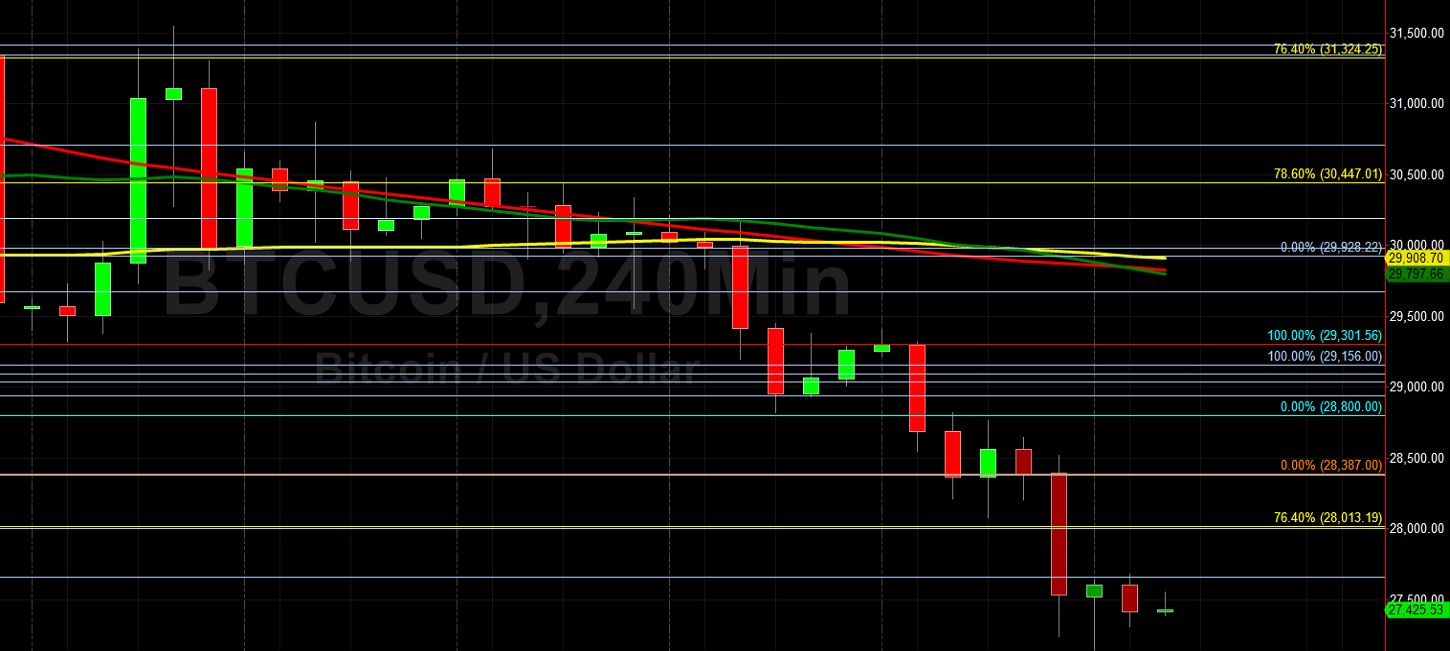
Bitcoin (BTC/USD) added to ongoing negative technical sentiment early in the Asian session as the pair continued to weaken below the psychologically-important 30000 figure, trading as low as the 27148.46 area. Traders drove BTC/USD down to weakest print since 12 May before encountering additional selling pressure around the 28765.82 area. Stops were elected below the 28426 area, a downside price objective related to selling pressure that intensified around the 48240 area. Stops were recently elected above the 31324.25 area, representing the 76.4% retracement of the appreciating range from 21913.84 to 61788.45. If BTC/USD reclaims its upward trajectory, additional areas of potential technical resistance include the 32446, 32823, 33310, 33479, 33714, 34272, and 34467 levels. Recent moves to relative lows have opened up possible tests of additional short-term technical support around the 26773 and 26639 levels.
Stops have been elected below many downside price objectives during the ongoing weakness, including the 30435, 29645, 28927, and 28426 areas, downside price objectives related to selling pressure that intensified around the 47469, 47200, and 48240 areas. If BTC/USD resumes its depreciation, traders are eyeing additional downside price objectives around the 25142, 24365, and 21074 areas. Significant selling pressure hastened around the 31717, 31364, and 31289 areas, upside technical price objectives and retracement levels related to historical buying pressure around the 3858 area. Traders are observing that the 50-bar MA (4-hourly) is bearishly indicating below the 100-bar MA (4-hourly) and below the 200-bar MA (4-hourly). Also, the 50-bar MA (hourly) is bearishly indicating below the 100-bar MA (hourly) and below the 200-bar MA (hourly).
Price activity is nearest the 200-bar MA (4-hourly) at 29891.29 and the 50-bar MA (Hourly) at 29207.51.
Technical Support is expected around 24365.11/ 21074.87/ 20495.33 with Stops expected below.
Technical Resistance is expected around 40100.93/ 41570.88/ 43443.32 with Stops expected above.
On 4-Hourly chart, SlowK is Bearishly below SlowD while MACD is Bearishly below MACDAverage.
On 60-minute chart, SlowK is Bearishly below SlowD while MACD is Bullishly above MACDAverage.
Disclaimer: This trading analysis is provided by a third party, and for informational purposes only. It does not reflect the views of Crypto Daily, nor is it intended to be used as legal, tax, investment, or financial advice.