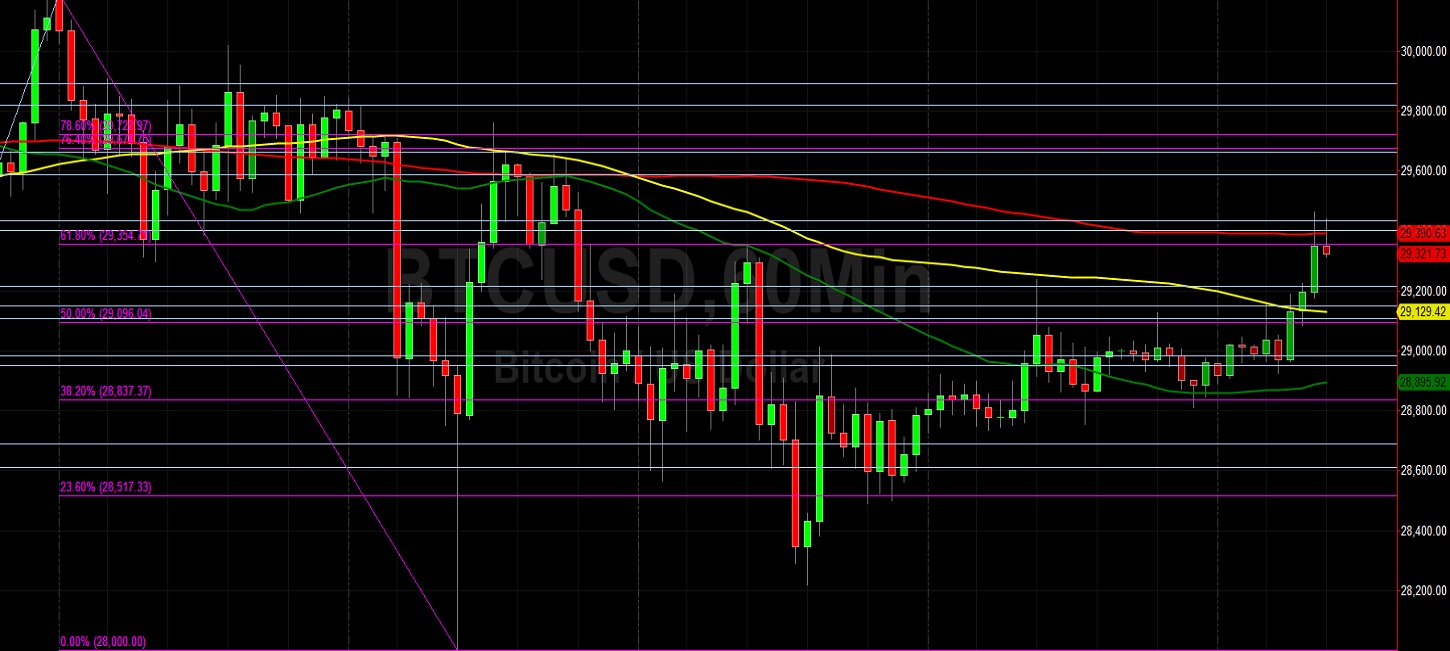
Bitcoin (BTC/USD) worked to sustain upside progress early in the Asian session as the pair reached the 29462.05 area after trading as low as the 28000 figure, finding some technical bids when testing the 50-hour simple moving average. Stops were elected above the 100-hour simple moving average and 29354.71 level during the move higher, representing the 61.8% retracement of the recent depreciating range from 30192.08 to 28000. Additional related upside price objectives include the 29674.75 and 29722.97 areas. The recent move to relative lows opened up possible tests of additional short-term technical support around the 27661, 26773, and 26639 levels.
Stops have been elected below many downside price objectives during the ongoing weakness, including the 30435, 29645, 28927, and 28426 areas, downside price objectives related to selling pressure that intensified around the 47469, 47200, and 48240 areas. If BTC/USD continues to depreciate, traders are eyeing additional downside price objectives around the 25142, 24365, and 21074 areas. Significant selling pressure hastened around the 31717, 31364, and 31289 areas, upside technical price objectives and retracement levels related to historical buying pressure around the 3858 area. Traders are observing that the 50-bar MA (4-hourly) is bearishly indicating below the 100-bar MA (4-hourly) and below the 200-bar MA (4-hourly). Also, the 50-bar MA (hourly) is bearishly indicating below the 100-bar MA (hourly) and below the 200-bar MA (hourly).
Price activity is nearest the 50-bar MA (4-hourly) at 29379.73 and the 200-bar MA (Hourly) at 29330.71.
Technical Support is expected around 24365.11/ 21074.87/ 20495.33 with Stops expected below.
Technical Resistance is expected around 40100.93/ 41570.88/ 43443.32 with Stops expected above.
On 4-Hourly chart, SlowK is Bullishly above SlowD while MACD is Bullishly above MACDAverage.
On 60-minute chart, SlowK is Bullishly above SlowD while MACD is Bullishly above MACDAverage.
Disclaimer: This trading analysis is provided by a third party, and for informational purposes only. It does not reflect the views of Crypto Daily, nor is it intended to be used as legal, tax, investment, or financial advice.