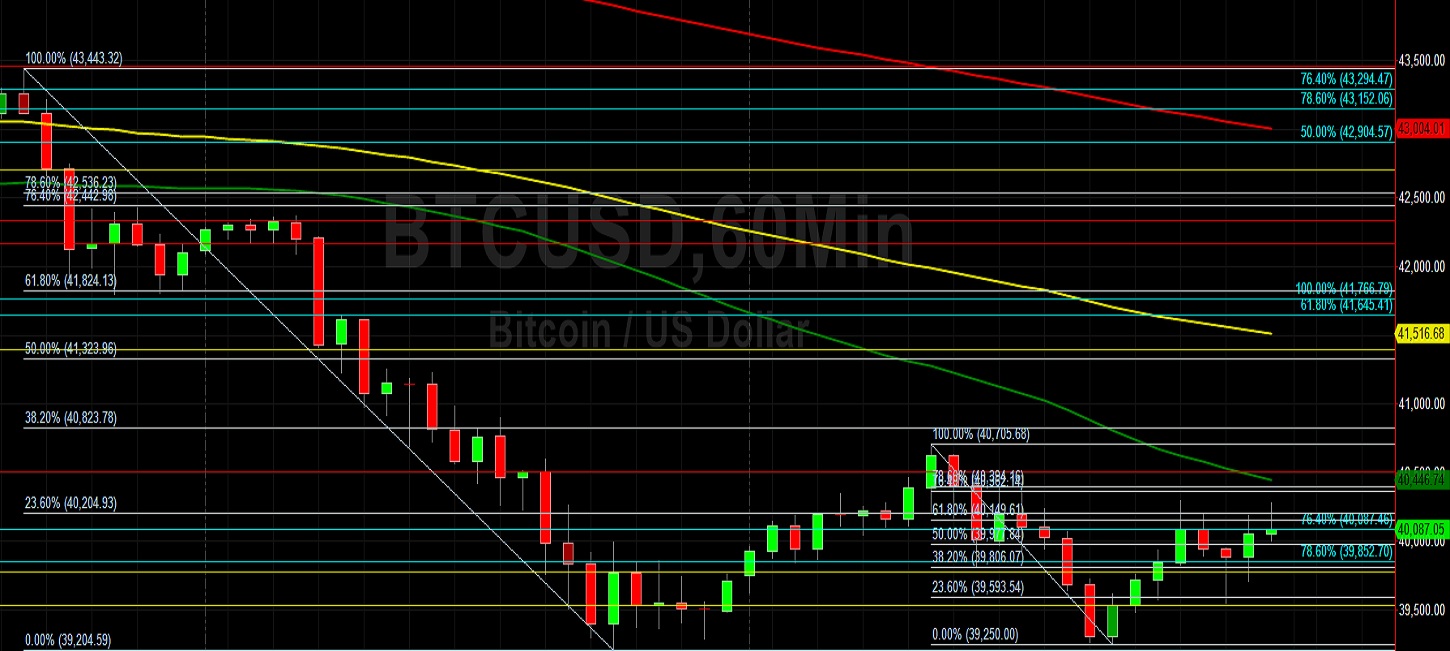
Bitcoin (BTC/USD) sought fresh technical sentiment early in the Asian session as the pair continued to orbit the psychologically-important 40000 figure after trading as low as the 39250 area. Traders are waiting to see if BTC/USD can test and sustain a break of the 40394.16 level, a short-term hurdle that represents the 78.6% retracement of the depreciating range from 40705.68 to 39250. Technicians are also paying close attention to the 40586.67 area that represents the 50% retracement of the appreciating range from 32933.33 to 48240. Similarly, traders are also focusing on the 39638.68 area that represents the 61.8% retracement of the appreciating range from 34322 to 48240. Additional downside retracement levels include the 38780.48, 36545.70, and 36208.96 levels, technically significant areas related to the appreciating range from 32933.33 to 48240.
BTC/USD recently traded at a 2022 high around the 48240 area before ceding some gains. Additional upside price retracement levels that traders are closely monitoring include the 48574, 49774, 50362, 50636, and 50966 levels. Following the recent move higher, areas of potential technical support and buying pressure include the 38832, 38670, 37797, 37119, and 35626 areas. Areas of potential technical resistance and selling pressure include the 50966, 55222, 60488, and 61281 levels. Traders are observing that the 50-bar MA (4-hourly) is bearishly indicating below the 100-bar MA (4-hourly) and below the 200-bar MA (4-hourly). Also, the 50-bar MA (hourly) is bearishly indicating below the 100-bar MA (hourly) and below the 200-bar MA (hourly).
Price activity is nearest the 50-bar MA (4-hourly) at 42944.65 and the 50-bar MA (Hourly) at 40447.06.
Technical Support is expected around 38670.39/ 37797.03/ 34190.77 with Stops expected below.
Technical Resistance is expected around 48574.70/ 50966.67/ 51595.38 with Stops expected above.
On 4-Hourly chart, SlowK is Bearishly below SlowD while MACD is Bearishly below MACDAverage.
On 60-minute chart, SlowK is Bullishly above SlowD while MACD is Bullishly above MACDAverage.
Disclaimer: This trading analysis is provided by a third party, and for informational purposes only. It does not reflect the views of Crypto Daily, nor is it intended to be used as legal, tax, investment, or financial advice.