Bitcoin
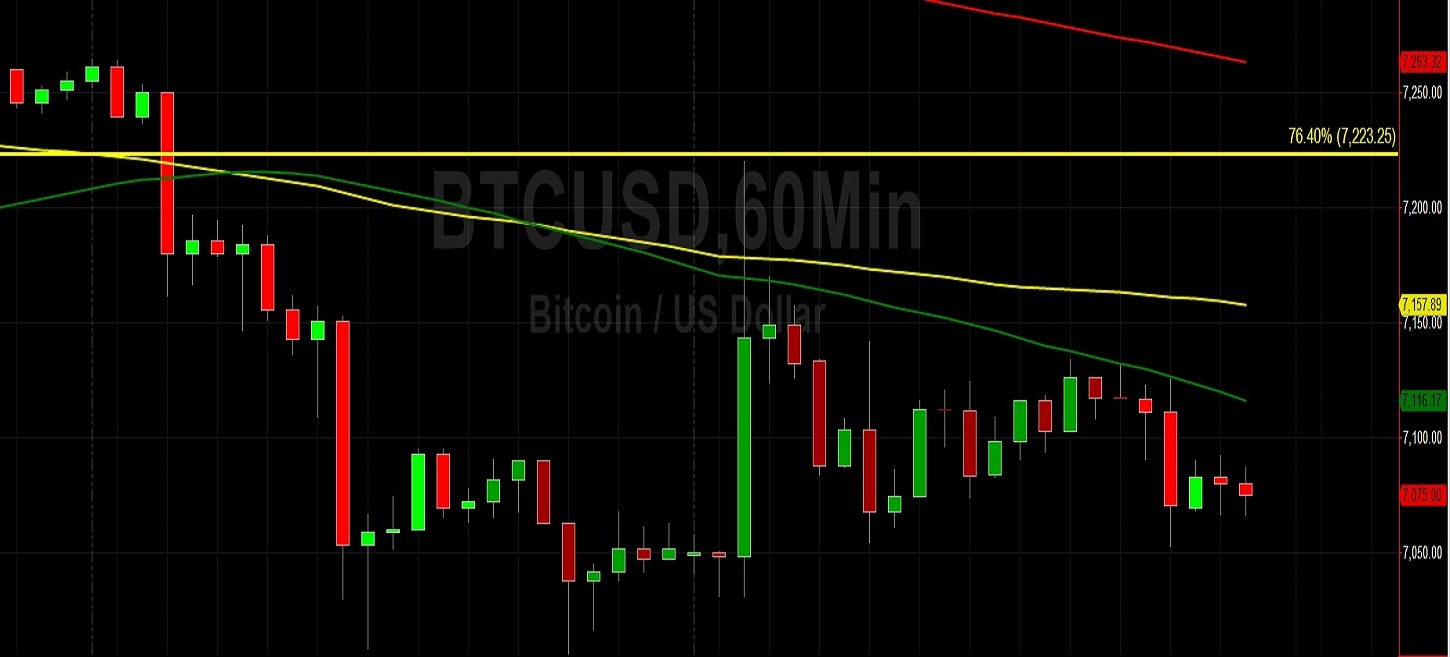
Bitcoin (BTC/USD) weakened early in today’s Asian session as the pair traded as low as the 7052.66 area following a steady decline from the 7220.01 area during Sunday’s European session. Bearish sentiment intensified over the weekend as renewed selling pressure emerged and pushed the pair below some technical Support levels. Bids around the 7223.25 level ceded ground to BTC/USD Bears again, knocking the pair lower to just above the psychologically-important 7000 figure. During the push lower, selling pressure also became elevated after Stops were elected below the 7084.98 area, representing the 23.6% retracement of the move from 19891.99 to 3128.89.
Stops were also elected below the 7039.45 area during the move lower this weekend, and this is important because the level represents the 61.8% retracement of the 6526.00 – 7870.10 range. This is the first time this level has been tested and broken since the market’s move to 7870.10, and it opens up a move lower to the 6843.21 area, the next downside price objective in the range and one that represents its 76.4% retracement. The 50-bar MA (hourly) and 100-bar MA (hourly) have recently converged, an indication traders will be seeking a new short-term bias soon.
Price activity is nearest the 50-bar MA (4-hourly) at 7,253.84 and the 50-bar MA (Hourly) at 7,116.23.
Technical Support is expected around 6775.47/ 6653.57/ 6323.42 with Stops expected below.
Technical Resistance is expected around 7870.10/ 8062.04/ 8338.78 with Stops expected above.
On 4-Hourly chart, SlowK is Bullishly above SlowD while MACD is Bearishly below MACDAverage.
On 60-minute chart, SlowK is Bearishly below SlowD while MACD is Bearishly below MACDAverage.
Ethereum
Ethereum (ETH/USD) depreciated early in today’s Asian session as the pair fell to the 141.36 area after trading as high as the 143.99 area during yesterday’s European session. Negative market sentiment became elevated during the weekened when ETH/USD Bears were able to push the pair through some areas of technical Support. One level that fell was the 140.61 area, representing the 38.2% retracement of the move from 100.15 to 165.62. The move below this area opened up the 139.13 level as an immediate downside price objective, an area that represents the 38.2% retracement of the move from 165.62 to 122.75. The 50-bar MA (4-hourly) and the 100-bar MA (4-hourly) have recently Bearishly diverged, suggesting some additional market weakness could be in store.
The 141.71 level represents the 61.8% retracement of the move from 131.80 to 157.73, and the recent move below this area is the first time this level has been tested since the pair established a recent relative high around the 157.73 area. Below that area, the 137.92 level represents the 76.4% retracement of the same range, and if this level gives way then ETH/USD Bears could take a run at the 131.80 area. Below that level, the 127.14 area remains a significant downside price objective that represents the 23.6% retracement of the 199.56 – 104.77 range.
Price activity is nearest the 50-bar MA (4-hourly) at 145.03 and the 50-bar MA (Hourly) at 142.40.
Technical Support is expected around 137.92/ 131.80/ 127.14 with Stops expected below.
Technical Resistance is expected around 146.59/ 149.31/ 152.11 with Stops expected above.
On 4-Hourly chart, SlowK is Bearishly below SlowD while MACD is Bullishly above MACDAverage.
On 60-minute chart, SlowK is Bearishly below SlowD while MACD is Bearsihly below MACDAverage.