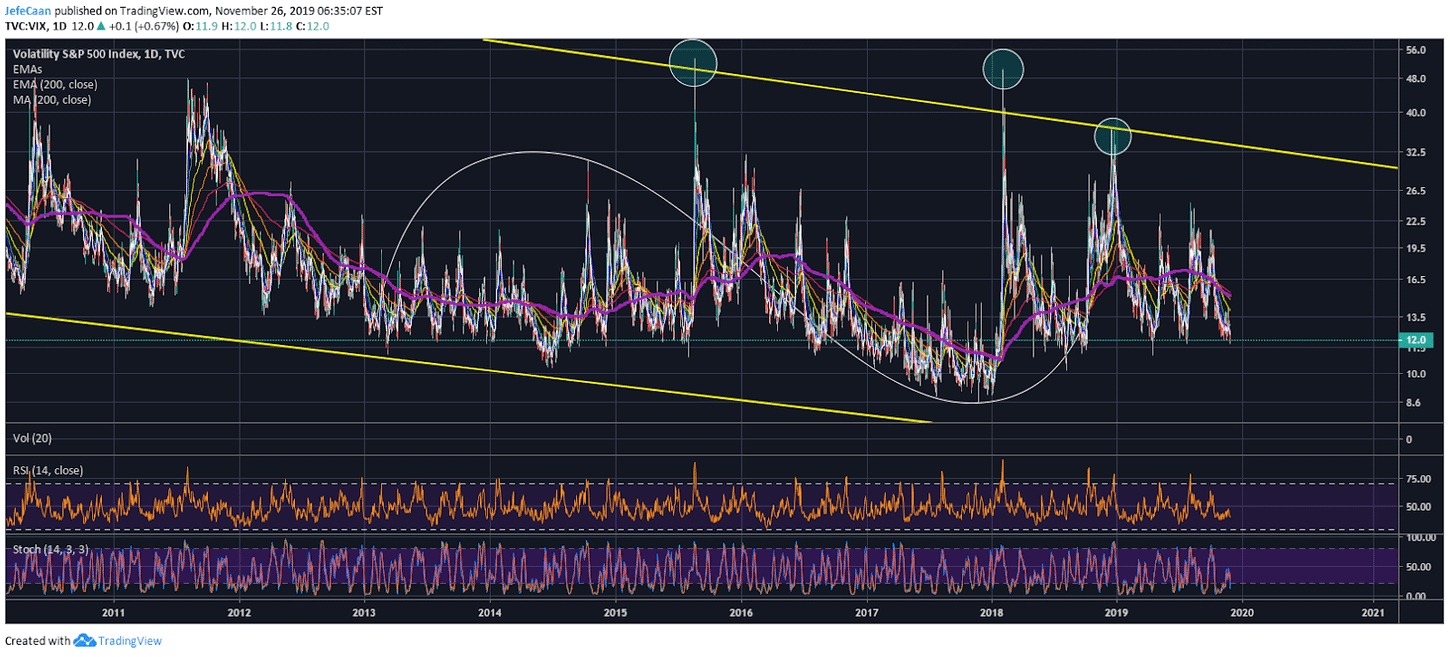
The Volatility Index (VIX) has historically been a good indicator of big moves in the cryptocurrency market. The daily chart for the index shows that around the last three major peaks, we have seen big moves in Bitcoin (BTC) mostly trend reversals. It has now declined down to a level where another peak could soon be expected. This time, it is likely to correspond to a sharp decline in the cryptocurrency market. Bitcoin (BTC) has been attempting to break past the 5 day exponential moving average but so far it has failed. The price remains at risk of further downside even though it has already declined to the bottom of the descending channel.

Last week’s close below the 100 EMA was very significant and with the S&P 500 (SPX) appearing to have topped out, things do not look good for Bitcoin (BTC) and the rest of the cryptocurrency market. A sharp decline from here would mean that the price would not only be breaking the current descending channel but it would be entering a new descending channel, one that could see the price eventually plunge below the 200 Week EMA for BTC/USD to find its true bottom between $1,200 and $3,000. The fact that the price has come this close to the 200 Week EMA in such a short time is not a good sign and it tells us that the big players are losing interest in this market amid an uncertain outlook of the stock market. Everyone knows the market has to crash at some point no matter how high it goes short term. It is quite clear that the market is now long overdue for a strong correction and when that begins, it will hit the cryptocurrency market hard.
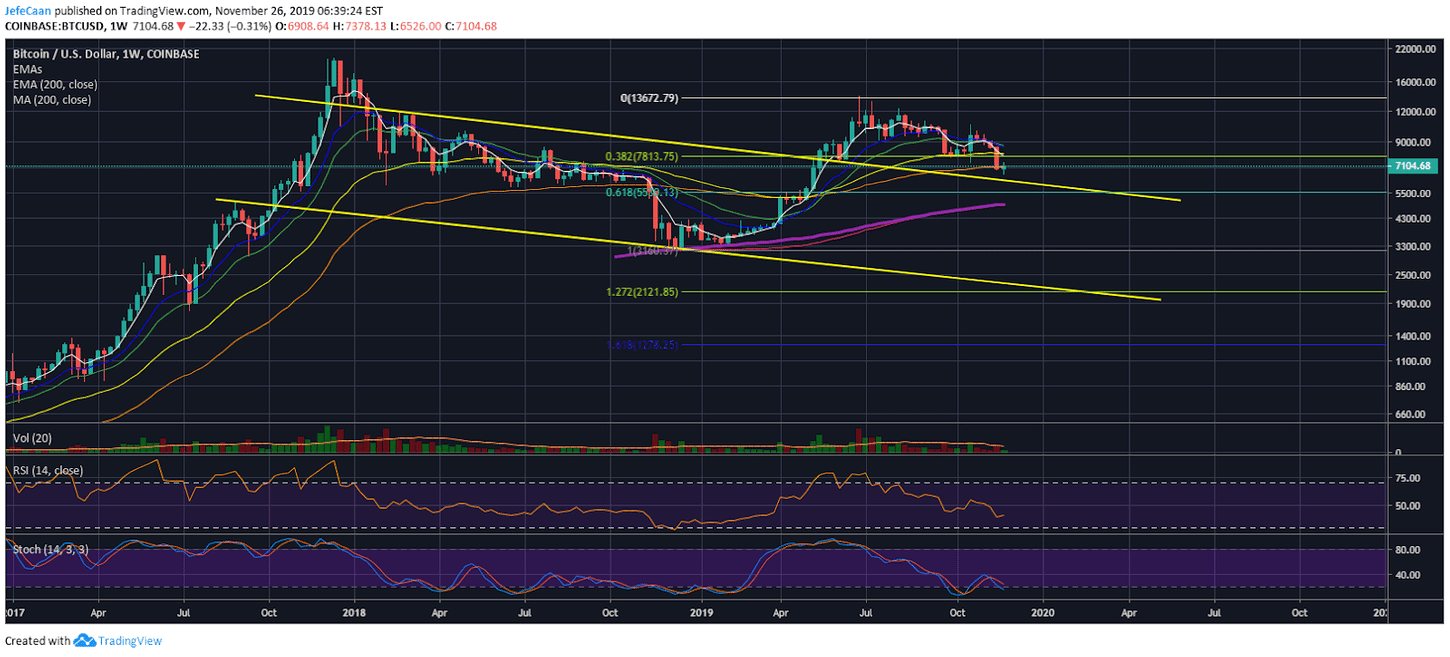
The weekly chart for BTC/USD shows the price close to the top of the next descending channel that Bitcoin (BTC) would be expected to decline down to. If the price ends up testing the 200 Week EMA then it would be entering this channel. If we look at this chart without any bullish bias, we can say that the price has formed a double top and is now expected to decline much lower.
In all fairness, a target of $1,200-$3,000 would still be quite bullish for Bitcoin (BTC) because that would mean that we could see a rally higher in the future. Imagine what could happen if this really plays out like a double top and we see a decline below the descending channel down to $1,200 and potentially lower than that to a triple digit price. That would be a whole other scenario which could mean that it might be a very long time before we see another bullish cycle in BTC/USD assuming there is one.