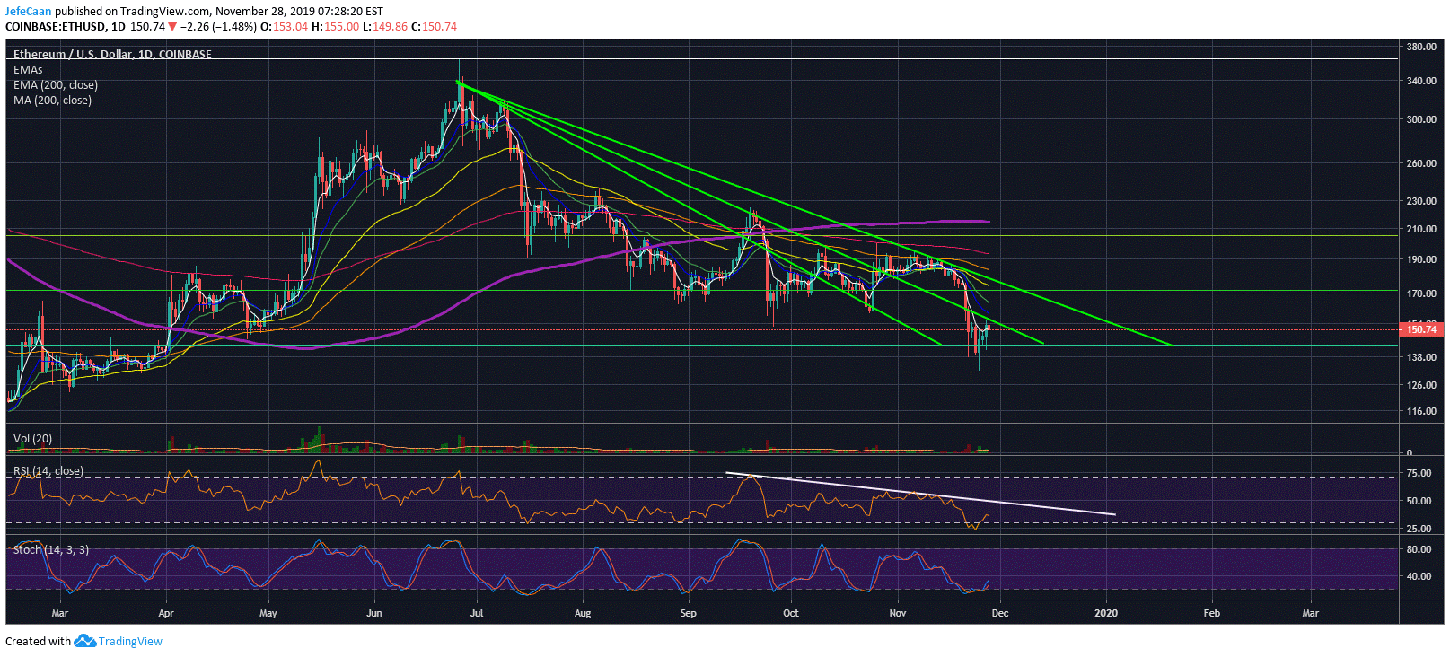
Ethereum (ETH) has plenty of room for further upside. Yesterday’s move saw the cryptocurrency lose ground against Bitcoin (BTC) but it still gained significantly against the US Dollar (USD). The daily chart for ETH/USD shows that the price might attempt to test the 50% fib extension level at $171 before the next downtrend. RSI on the daily time frame also supports such a move. This means that we could see a bullish move not only in Ethereum (ETH) but in other altcoins in the days and weeks ahead. At a point in the market when retail traders have been fearing further downside and betting on it, there is a high probability that the market makers would shake them out while trapping in more bulls at the same time.

Before yesterday’s move came into effect, we talked about the high probability of such a move because it was not in the interest of the market makers to have pulled the price lower. They would have wanted to shake out more bears and trap in more bulls to be shaken out later on and that is exactly what happened. Please note that there are still many retail traders waiting for the price to crash below $144 and decline down to $120 or $80 from current levels. The market makers are very likely to shake out those kind of traders before the next downtrend. This would have the two pronged effect of discouraging more shorts and making more profits short term on the market makers’ side. While chart analysis is important, understanding the game, having the foresight to see what lies ahead and devising a strategy to execute with proper risk management is a lot more important.
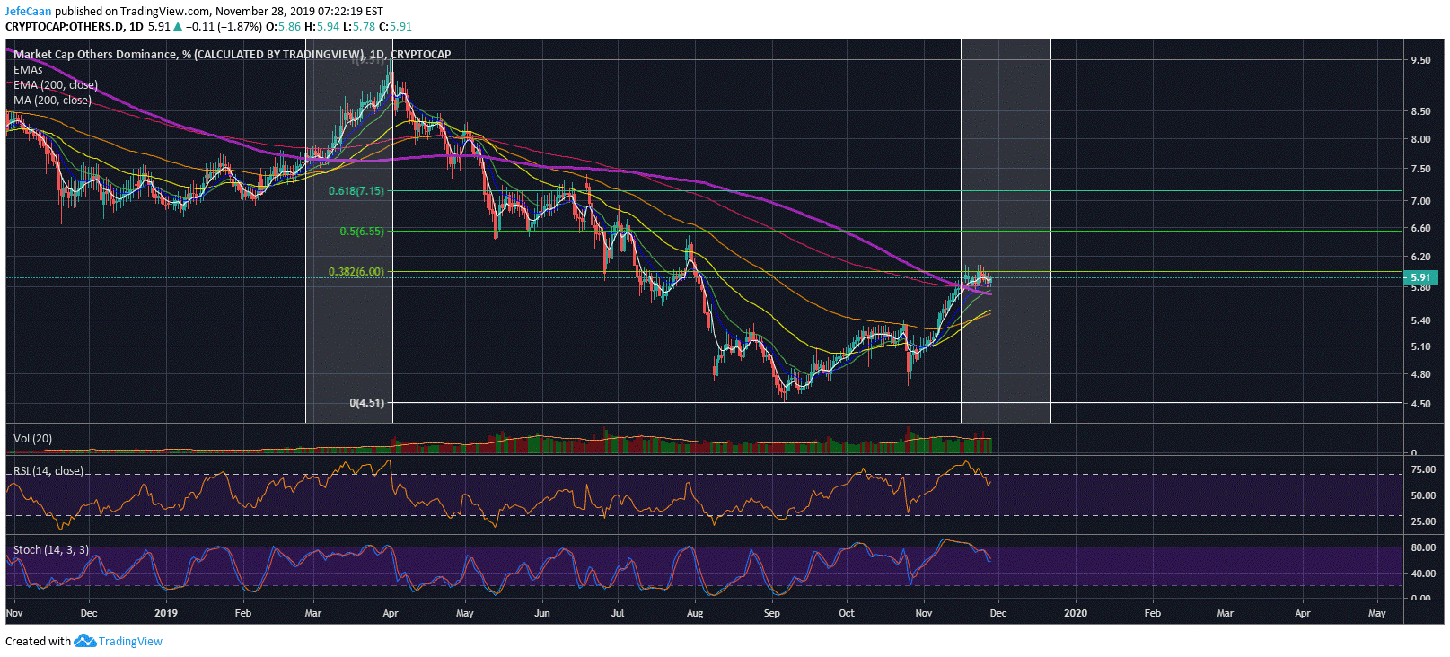
The daily chart for Altcoin Dominance (Others.D) is a good indicator of what lies ahead not just for the altcoin market but for the whole market. We saw Altcoin Dominance (Others.D) rally past the 200 day moving average in March which led to a major altcoin rally. However, as you can see it only lasted the duration of one month. During that time, a lot of retail traders got overly excited about altcoins and they kept on buying even as altcoin dominance (Others.D) began its downtrend and then plunged way below the 200 day moving average.
Most of the traders that bought altcoins during that period ended up losing money in the months that followed. In fact, most of their investments are still under water. The interesting thing is, markets keep on printing the same cycles over and over but people also keep making the same mistakes over and over. We could see Altcoin dominance (Others.D) break past the 38.2% fib retracement level to begin an uptrend but just like before, it is expected to be short lived. However, most traders would keep on buying even as the market declines. They would make up stories like “people are selling temporarily just because of Christmas” and then “people are selling because of new year” until it is too late to get out of the market.