Bitcoin
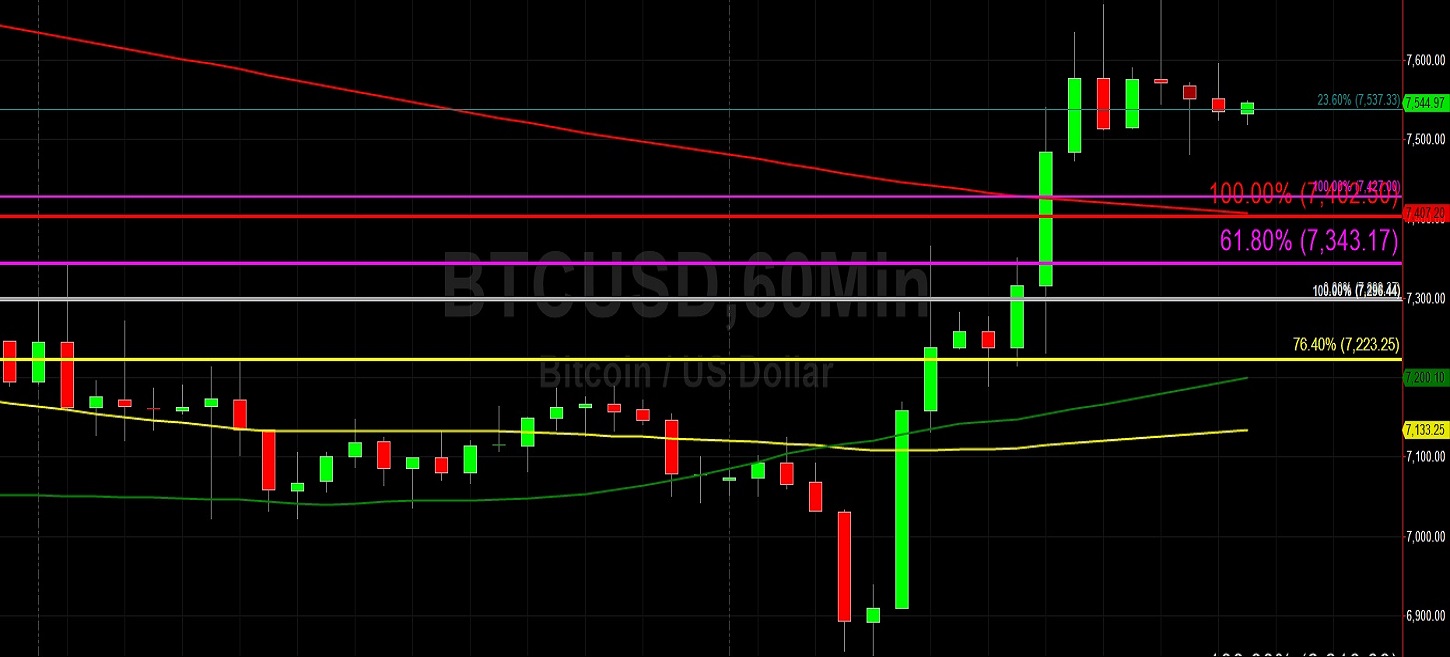
Bitcoin (BTC/USD) appreciated early in today’s Asian session as the pair moved back to the 7595.00 area after trading as high as the 7678.76 level in yesterday’s North American session. Strong buying activity commenced during yesterday’s North American session after the pair remained above the 6810.00 level. Bearish technical trading sentiment continues to impact the pair following its 38% peak-to-trough rout between October and November, a decline that became exacerbated during the last several days when the pair crashed through several key technical levels. Those areas included the 8289, 7594, and 6899 areas and traders will be closely watching price activity when it returns to these levels. Following the pair’s recent low print of 6526.00, technicians are eyeing the 7473.42 area as one that is technically-significant as it represents the 23.6% retracement of the move from 10540.49 to 6526.00. The next upside price retracement level related to that range is 8059.54, representing the 38.2% retracement.
BTC/USD Bears continue to speculate that selling pressure could resume, and a couple of important downside areas include the 6323 and 6038 levels. Below those levels, the 4648 area is being closely watched and some traders continue to believe weaker long positions could be shaken out if some of these downside levels are probed. Some additional levels that chartists are monitoring include the 5808 and 5733 levels, with the latter right around the 38.2% retracement of the move from 9948.12 to 3128.89. Likewise, the 5663.42 area is also technically significant as it represents the 76.4% retracement of the move from 3128.89 to 13868.44.
Price activity is nearest the 50-bar MA (4-hourly) at 7,404.70 and the 200-bar MA (Hourly) at 7,407.08.
Technical Support is expected around 6775.47/ 6653.57/ 6323.42 with Stops expected below.
Technical Resistance is expected around 7686.35/ 8062.04/ 8338.78 with Stops expected above.
On 4-Hourly chart, SlowK is Bullishly above SlowD while MACD is Bullishly above MACDAverage.
On 60-minute chart, SlowK is Bearishly below SlowD while MACD is Bullishly above MACDAverage.
Ethereum
Ethereum (ETH/USD) moved higher early in today’s Asian session as the pair traded as high as the 154.44 level after reaching the 155.89 area during yesterday’s North American session. Decent buying lifted the pair from the 141.02 area during yesterday’s European session. The pair’s 41.5% peak-to-trough depreciation during October and November pushed the pair to levels not seen since March of this year. The intense selling pressure that has impacted the pair during the past week has also increased the possibility of sudden short coverings that could propel the pair higher. The 153.73 area is one that price activity could orbit during a rebound, and it is technically significant because it represents the 23.6% retracement of the 224.71 – 131.80 range.
Below that level, the 147.78 area is also technically significant as it represents the 23.6% retracement of the move from 199.50 to 131.80. The next upside level in that range is the 157.66 area, representing the 38.2% retracement, and the next upside level in the broader depreciation from the 224.70 area is the 167.29 area. If downside pressures return and intensify, the 132.90 area will be closely scrutinised again, especially as it is a major level that represents the 23.6% retracement of the 302.20 – 80.60 range. The 127 area is also one that ETH/USD Bears are monitoring as another downside price target.
Price activity is nearest the 50-bar MA (4-hourly) at 154.66 and the 200-bar MA (Hourly) at 154.87.
Technical Support is expected around 132.90/ 125.16/ 122.75 with Stops expected below.
Technical Resistance is expected around 155.89/ 165.62/ 176.25 with Stops expected above.
On 4-Hourly chart, SlowK is Bullishly above SlowD while MACD is Bullishly above MACDAverage.
On 60-minute chart, SlowK is Bearishly below SlowD while MACD is Bullishly above MACDAverage.