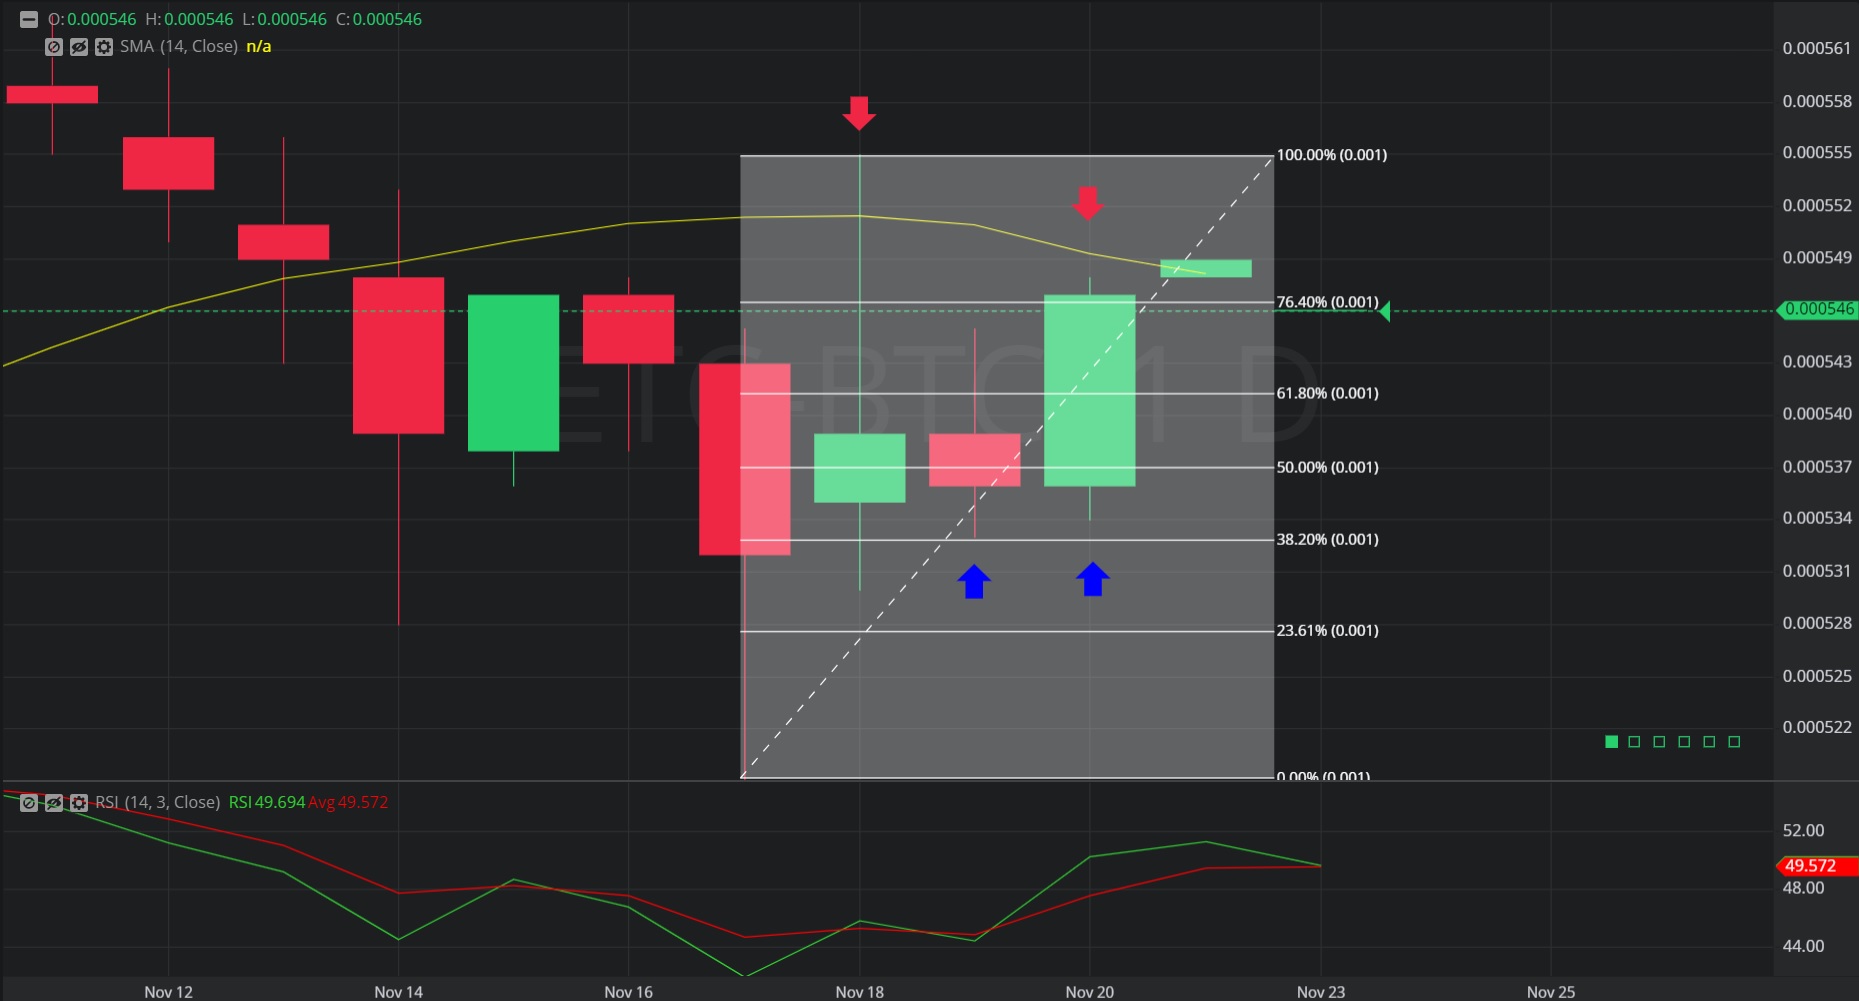
In this Daily chart of Ethereum Classic/ Bitcoin (ETC/BTC), there is an appreciating range from 0.000519 to 0.000555.
We can see the 14-day Simple Moving Average (indicated by the first red down arrow) was not far below the range’s high of 0.000555.
We can see the price then depreciated to the 0.000533 area (indicated by the first blue up arrow), right around the 61.8% retracement of the appreciating range.
The pair then found additional technical support above the 0.000533 area (indicated by the second blue up arrow) and appreciated to the 0.000548 area (indicated by the second red down arrow), just above the 0.000547 level that represents the 23.6% of the appreciating range.
Using RSI, we can see the appreciation from the 0.000519 level coincided with increases in the positive slopes of both RSI (14) and RSI Average (3). Notably, the pair’s upside momentum slowed and this coincided with the return to a negative slope in RSI (14).
Stay on top of the cryptocurrency market with CryptoDaily’s trading charts!