Bitcoin (BTC) Has Finally Begun Its Downtrend. What Happens Next?
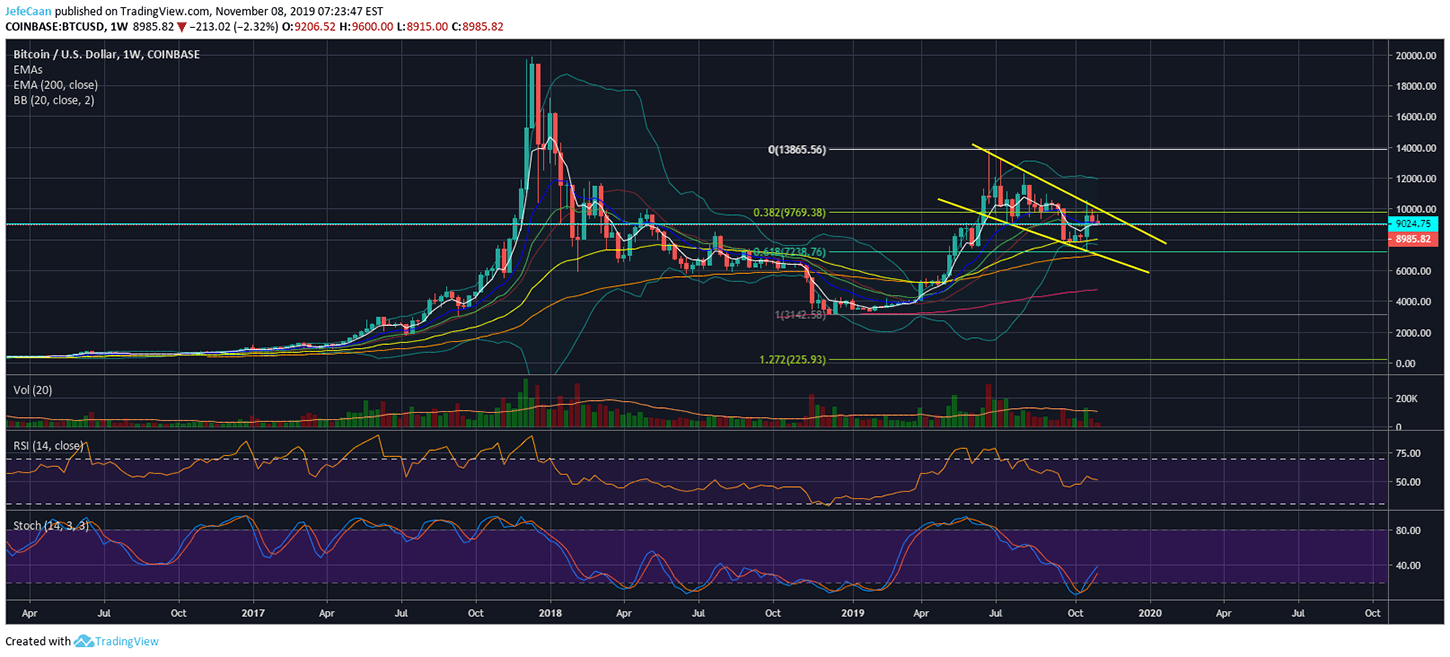
Bitcoin (BTC) is ready to decline further as it has begun its downtrend. The next few days are going to be crucial because we will see the market take a definitive direction. As of now, BTC/USD is still holding strong above the 21 Week EMA but it is unlikely to remain there for long. We are likely to see a major decline over the weekend. If the price does decline below the 21 Week EMA then it will be a sharp one and we might see a similar downtrend to what we have seen in the past when BTC/USD has crashed after trading sideways at the top. Now that the price has faced a rejection at the 38.2% fib retracement level, the next level we expect it to decline to is the 61.8% fib retracement level which is around $7,239 on the non-logarithmic chart.

We have seen traders become really complacent this year as everyone has been bullish on BTC/USD and it had become far too easy to do that. After the parabolic run up that saw the price tear through the $6,000 level, we saw traders become too optimistic and that optimism has still not died down despite the fact that the price has established a clear downtrend since it topped out at $13,865. Those that are bullish on BTC/USD at this point are betting on the price breaking out of the descending channel to begin another uptrend. If we see the price close this week below the 21 Week EMA, that would be a sign that we are headed down to the bottom of the descending channel in the weeks ahead. Today’s daily close will also be quite significant because CME Bitcoin Futures close plays an important role in what happens in this market.
We have seen some buying interest around the $8,915 level because retail bulls think the price should be heading higher as the CME Futures gap has already been bridged. In my opinion, it is just another bull trap. It makes very little sense to be bullish on Bitcoin (BTC) at this point. Even if you expect the price to break out of the descending channel, it is important to at least wait for confirmation of that happening.
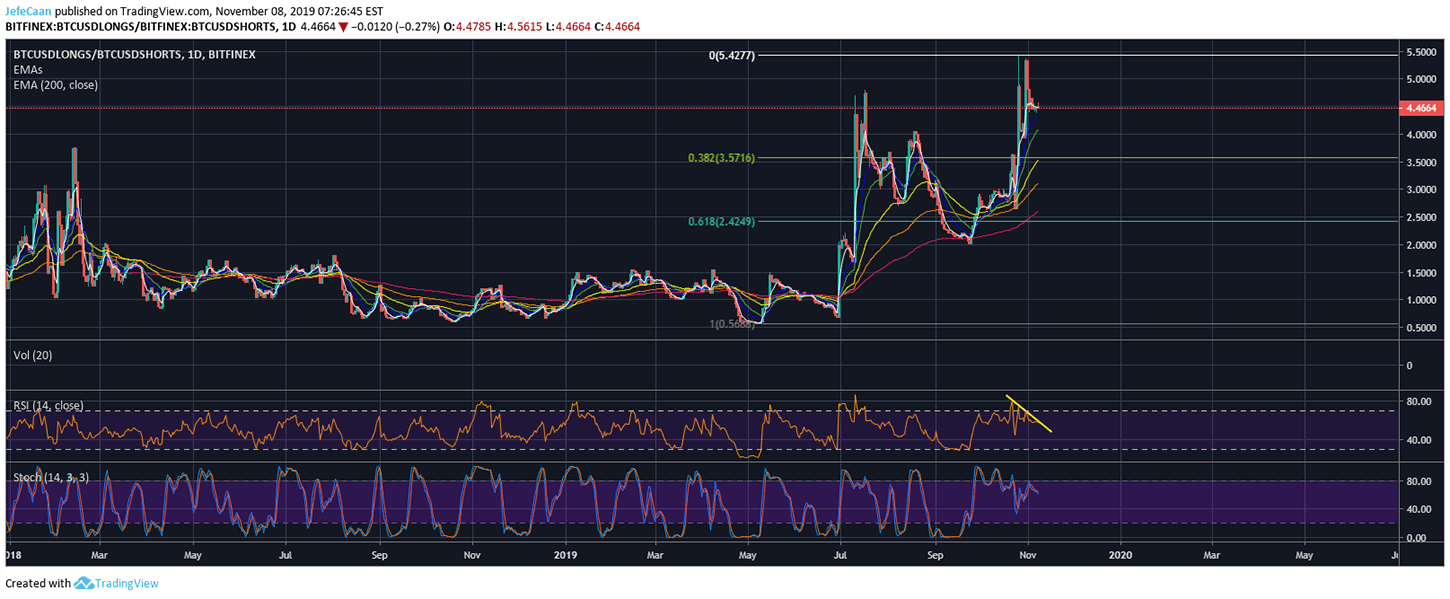
The daily chart for BTCUSDLongs/BTCUSDShorts shows that this pair is due for a major correction. It seems to have already begun that correction. The trend line on the RSI better shows the downtrend and until and unless that trend is broken it makes no sense to expect any bullishness in the market. Please note that this ratio could decline sharply in the event of a stop hunt which is quite likely if we see BTC/USD drop below $8,800 in the near future.