7 November 2019 ETH/BTC 4-hourly
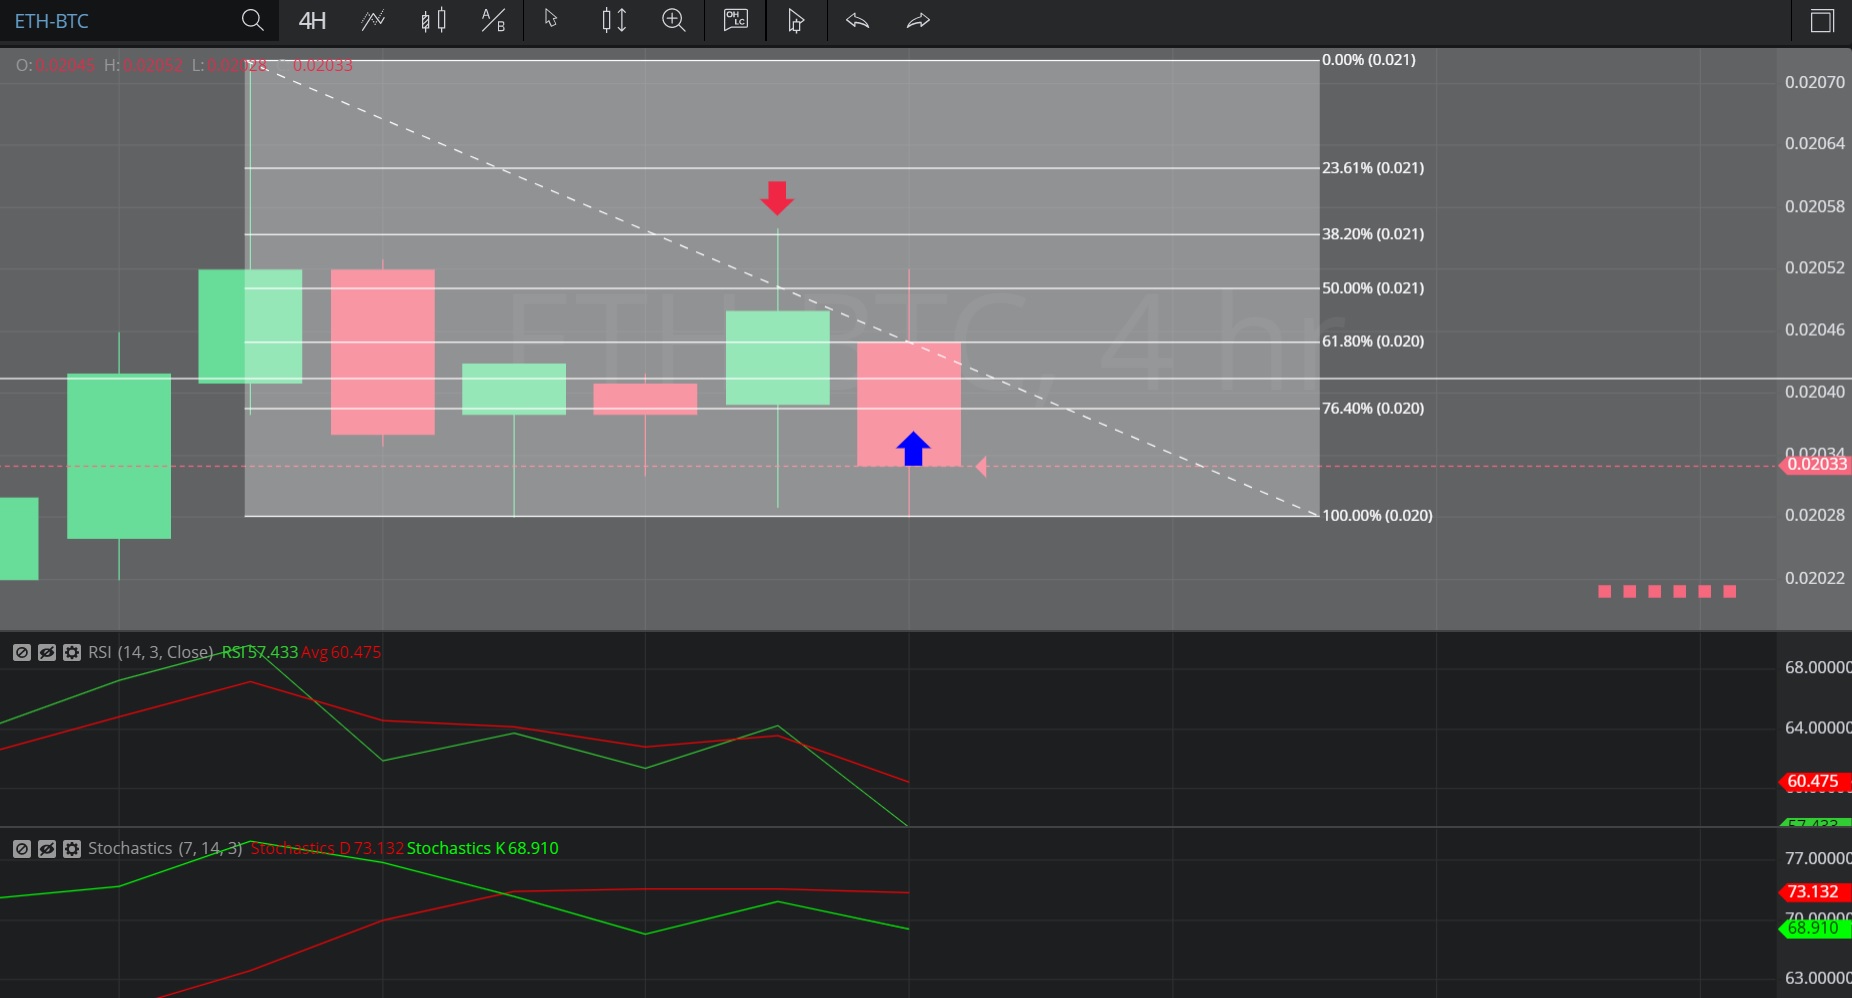
In this 4-hourly chart of Ethereum/ Bitcoin (ETH/BTC), we can see a recent depreciation from 0.02072 to 0.02028.
We can see that today the price appreciated to and tested the 0.020552 level (identified by the red down arrow), representing the 61.8% retracement of the aforementioned range.
We can see that price activity reached and traded below the 0.020384 level (identified by the blue up arrow), representing the 23.6% retracement of the aforementioned range.
Using RSI, the depreciation was confirmed by the change from a positive-sloping RSI (14) to a negative-sloping RSI (14) and the increasingly negative slope of RSI Average (3).
Using Slow Stochastics, the depreciation was also confirmed by an increasingly negative slope in both SlowD and SlowK, and a divergence between the two with SlowK indicating below SlowD.
These technical confirmations are Bearish.
Stay on top of the cryptocurrency market with CryptoDaily’s trading charts!
