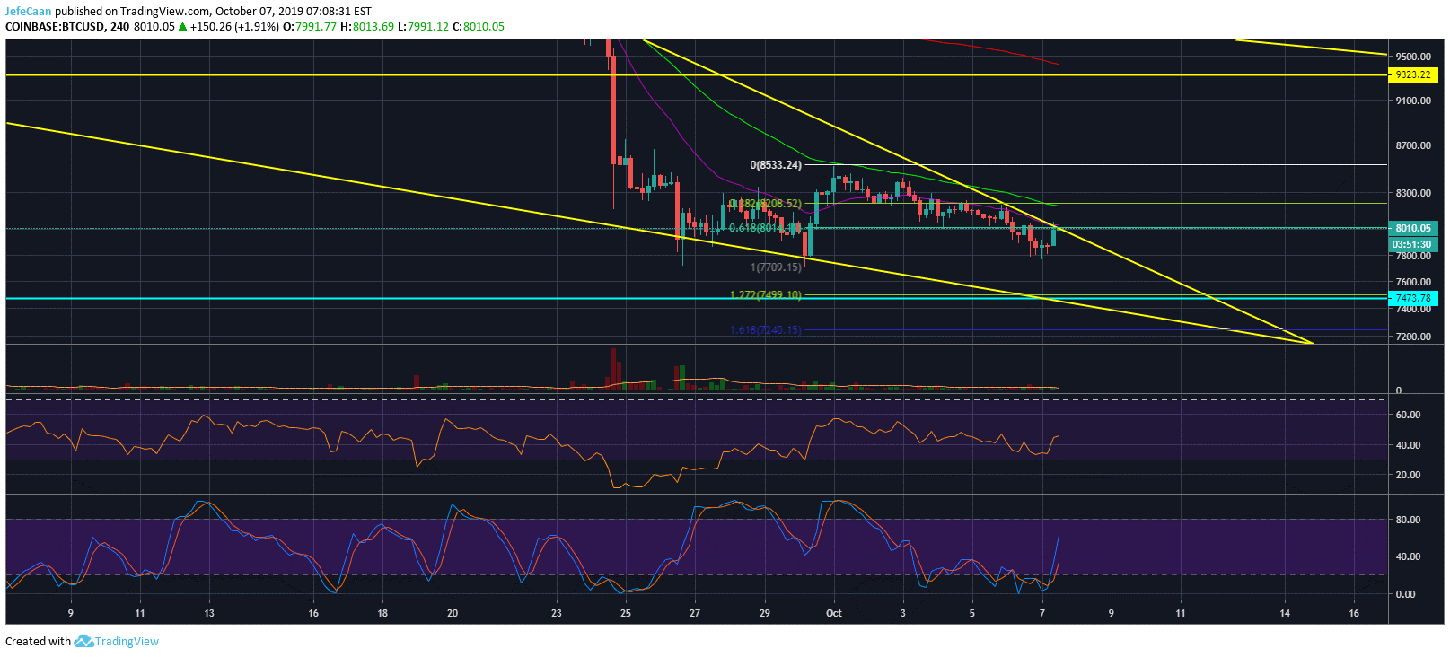
Bitcoin (BTC) is struggling to break past the 61.8% fib extension level but so far there is not enough momentum for a successful breakout. The probability of such a break to the upside also remains low considering the price has a lot of room to decline within the falling wedge. The reason a decline is more likely at this point is because the price is now trading under extremely overbought conditions on shorter time frames. On the 4H chart, we see that the Stochastic RSI shot up significantly in a very short period of time. In addition to that, the price failed to break past the 50 EMA on the 4H chart the last time and declined. That is how we knew that further downside was likely to follow.

The probability of the price declining would be very low if it did not mean to take out previous lows. This is why there is a good chance that we might see a decline to the bottom of the falling wedge potentially below $7,500 before price finds a temporary support and stages a relief rally. That being said, I still think BTC/USD has not bottomed yet and we are very likely to see it fall further to find its true bottom below $3,000. Recently, the price broke out of a similar falling wedge within the larger falling wedge to breakout. It was overextended but that is the way the market makers wanted it to be so as to trap in as many bulls as possible before the next downtrend kicks in. This is the way it has been happening the whole time. The charts and patterns change but the methods don’t.
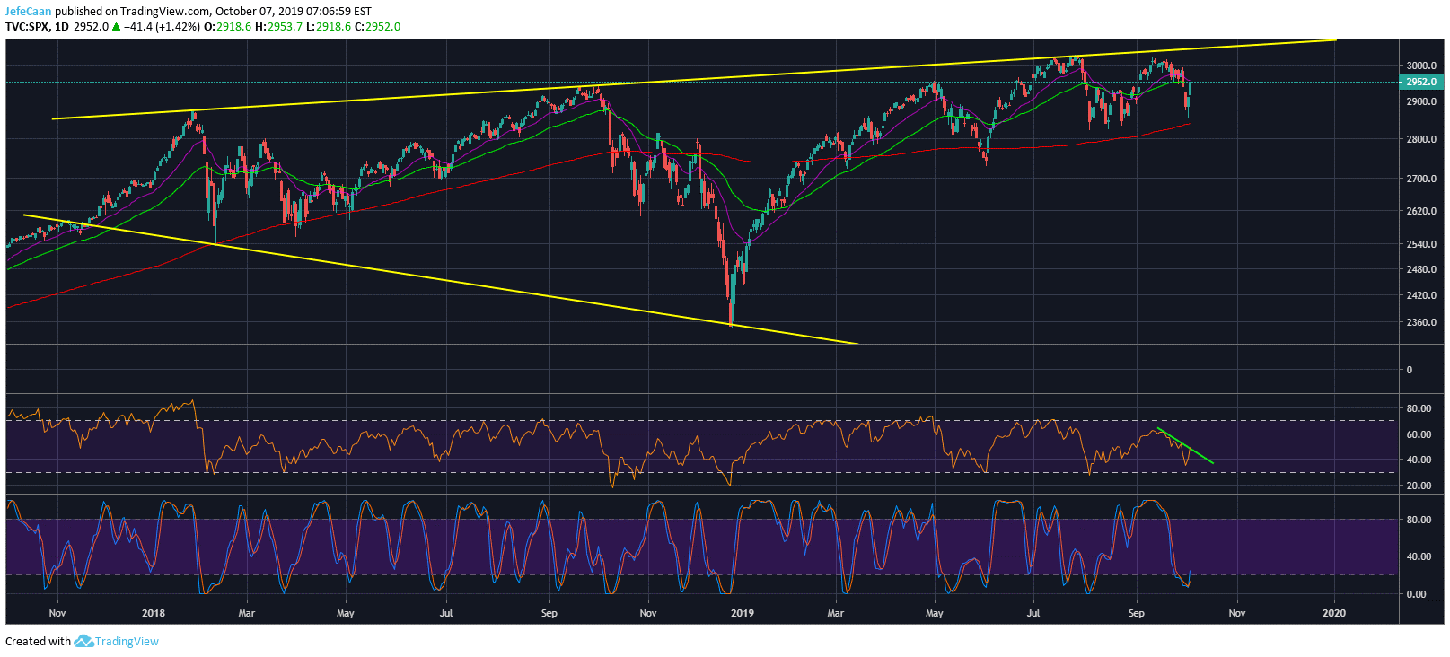
The daily chart for the S&P 500 (SPX) shows that the index has run into the 50 day EMA again. Whether or not it can lead to further upside has yet to be seen but the next move on this chart is very likely to influence what happens on the BTC/USD chart. If we see short term further upside in this market, we can expect similar upside in cryptocurrencies. However, if we see a decline in this index, then cryptocurrencies might decline even more aggressively and BTC/USD would be very likely to fall below $7,500.
RSI on the daily chart for S&P 500 (SPX) remains in a strong downtrend which is why the most probable move would be to the downside until that trend line resistance is broken. Even when that happens, we have to realize that the index does not have much room to rally. It is just stalling the inevitable and I don’t think it can do that for long. When the S&P 500 (SPX) begins its downtrend that is when we would see BTC/USD crash in the manner as it did when it broke market structure and declined below $6,000. This time it is expected to decline below $3,000 to eventually find its true bottom most likely around the next halving.