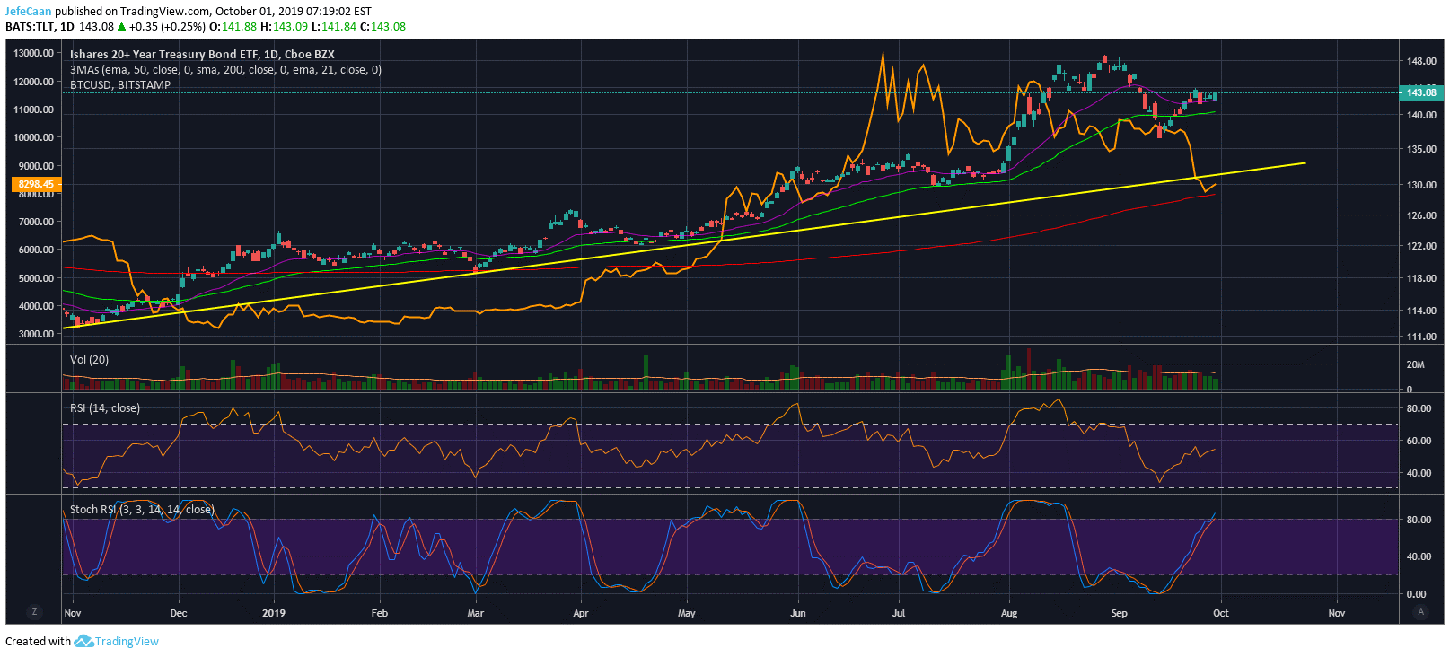
Bitcoin (BTC) has had a stronger positive correlation with the S&P 500 (SPX) in comparison to the 20+ Year Treasury Bonds (TLT). The reason for that is that Bitcoin (BTC) despite the narrative of digital gold, remains a highly speculative asset that has been seen to lose more ground than stocks when the S&P 500 (SPX) last entered a downtrend. Even though there may not be a formal correlation between the stock market and the cryptocurrency market, we have seen cryptocurrencies decline sharply whenever the stock market has declined. This is only reasonable to expect considering Bitcoin (BTC) belongs to the emerging assets class and not the safe haven assets class. The reason this correlation is not always clear is because of forced correlation with gold at times to reinforce the digital gold narrative.

We have seen in the past how Bitcoin (BTC) declined below $6,000 when the S&P 500 (SPX) began its downtrend in October, 2018. What’s different this time is that the upcoming downtrend will be a lot more aggressive than the previous one as there is a lot more room for decline. This means that we cannot discount the possibility of Bitcoin (BTC) crashing hard in long weekly or monthly candles in the near future. So, it is a very dangerous game to be bullish on Bitcoin (BTC) and other cryptocurrencies at this point especially when we have seen the cracks within the foundation. In my opinion, when the stock market falls, we will see investors go to the US Dollar (USD) and not Bitcoin (BTC) because here’s the thing. Most of us millennials that want to see Bitcoin (BTC) as digital gold do not have much of a stake in the market so what we want is not what really matters at least not yet.
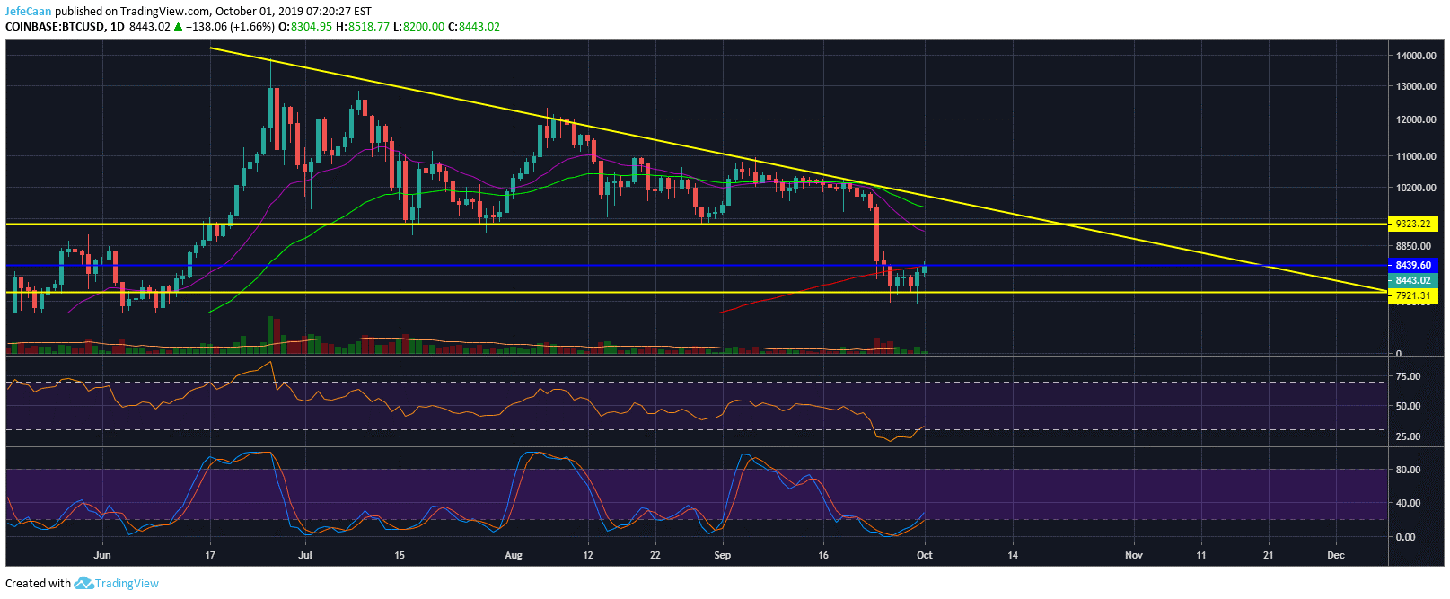
The daily chart for BTC/USD shows us how the market is on the verge of another major decline as BTC/USD has failed to close above the 200 day EMA. This is an alarming sign for cryptocurrency investors because Bitcoin (BTC) is still trading within a larger descending triangle which when broken to the downside would lead to a more aggressive downtrend than the one we saw when BTC/USD declined below $9,000. What is happening in the cryptocurrency market is perfectly in line with what we expect in the stock market which reinforces our bearish bias.
Investing is all about risk/reward. Even if you are bullish on BTC/USD at this point, you might have targets in mind that you think the price can hit. The simple way to assess whether the trade is worth it is to compare the potential upside to the potential downside. If we look at the price action here we can see that there is a strong resistance that the price would have to break past and even if it succeeds in doing that, there is a very strong probability of it being stopped at the previously broken descending triangle. That is the upside that we could expect at this point but the downside would be the price crashing straight below this descending triangle to fall towards the low $7,000s or even lower if the stop hunt is extended further.