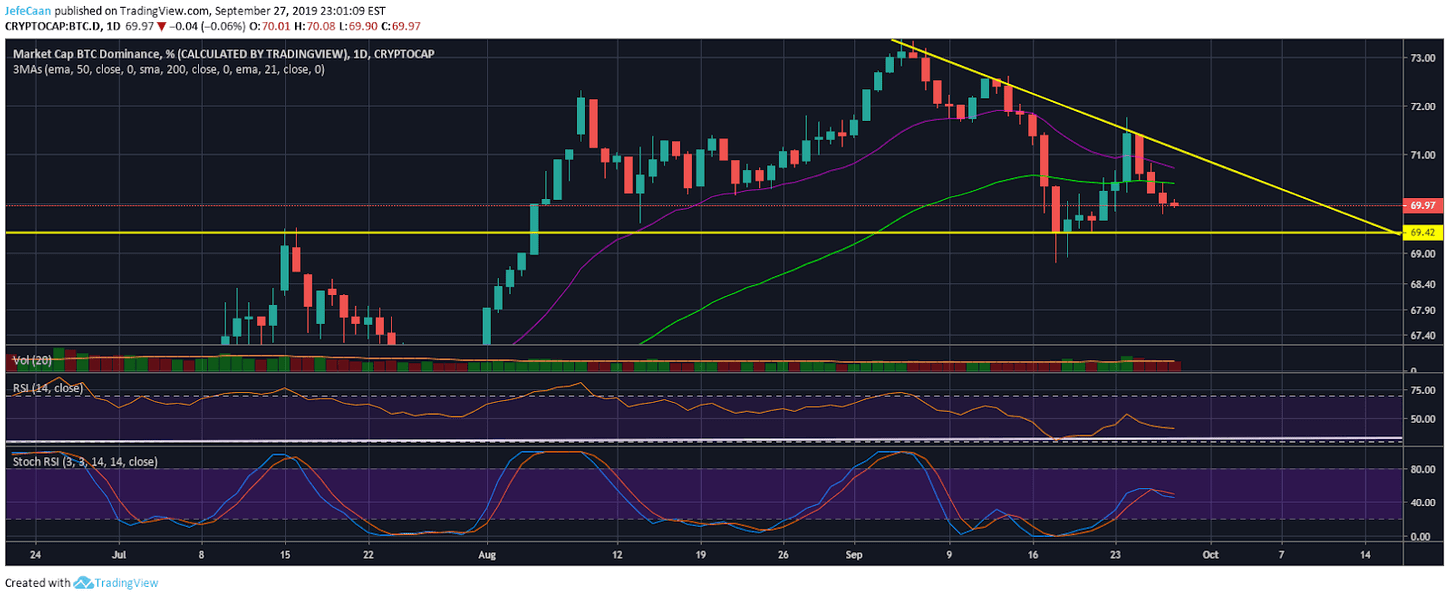
Bitcoin (BTC) is in a really tough spot now that it has declined and closed below the 200 day EMA. However, there is still significant hope for cryptocurrency bulls as Bitcoin dominance has been declining the past few days. In fact, we now have Bitcoin Dominance (BTC.D) trading within a large descending triangle. If it falls towards the bottom of this triangle, we might have a massive altcoin season on the corner and it would not be surprising to see Ethereum (ETH) and other altcoins massively outperform Bitcoin (BTC). Despite the fact that BTC/USD has closed below the 200 Day EMA and is now at risk of a decline below the 50 Week EMA, we have to see some sort of bullish recovery sooner or later.

If Bitcoin dominance (BTC.D) plunges below the key 69.42 support, the bullish recovery that we expect in the market would be much more aggressive contrary to the expectations of the majority of the market. This is why it is very unreasonable to enter short positions just yet especially aggressive short positions on high leverage. The market never rises or falls in one go. There are liquidity hunts that shake out the quick buck artists before the actual move comes into effect. We expect the same this time in the cryptocurrency market. We may see a short term decline as the Stochastic RSI has reached overbought levels on the 4H time frame but we are extremely unlikely to see a decline below $7,000 at this point. There will be another big move to the upside before that happens.
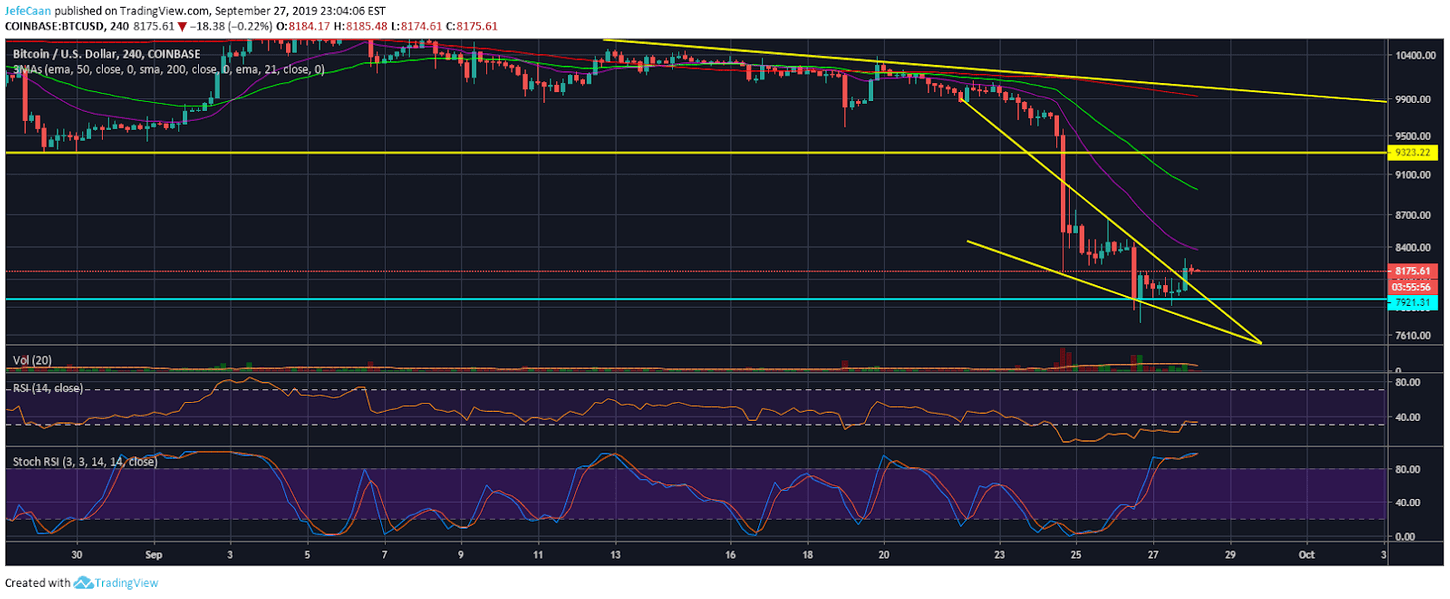
The 4H chart for BTC/USD gives us mixed signals. If you are not a price action trader, you wouldn’t be able to understand why the price did not just break out of the falling wedge to shoot higher. This is when it becomes more useful to use indicators to show us the whole picture. As we can see, Stochastic RSI on the 4H chart for BTC/USD is close to topping out. This will likely be followed by a move to the downside which will give the falling wedge another shape and technical analysts would have to move some lines here and there.
I don’t lay much emphasis on the finality of such trend lines because most of the time they are invalidated as they are soft targets for the market makers. That being said, horizontal lines are very important and thus should be given preference over trend lines. Looking at this chart, I see one of two scenarios playing out. Either we see a decline towards the top of the falling wedge and find support at the confluence of the horizontal as well as trend line support or we see a decline below the horizontal support to give a new shape to the falling wedge. No matter how it plays out, I expect this to be the last decline before we see bullish recovery follow short term.