Bitcoin (BTC) Correction May Still Not Be Over As Bulls Fail To Gain Control
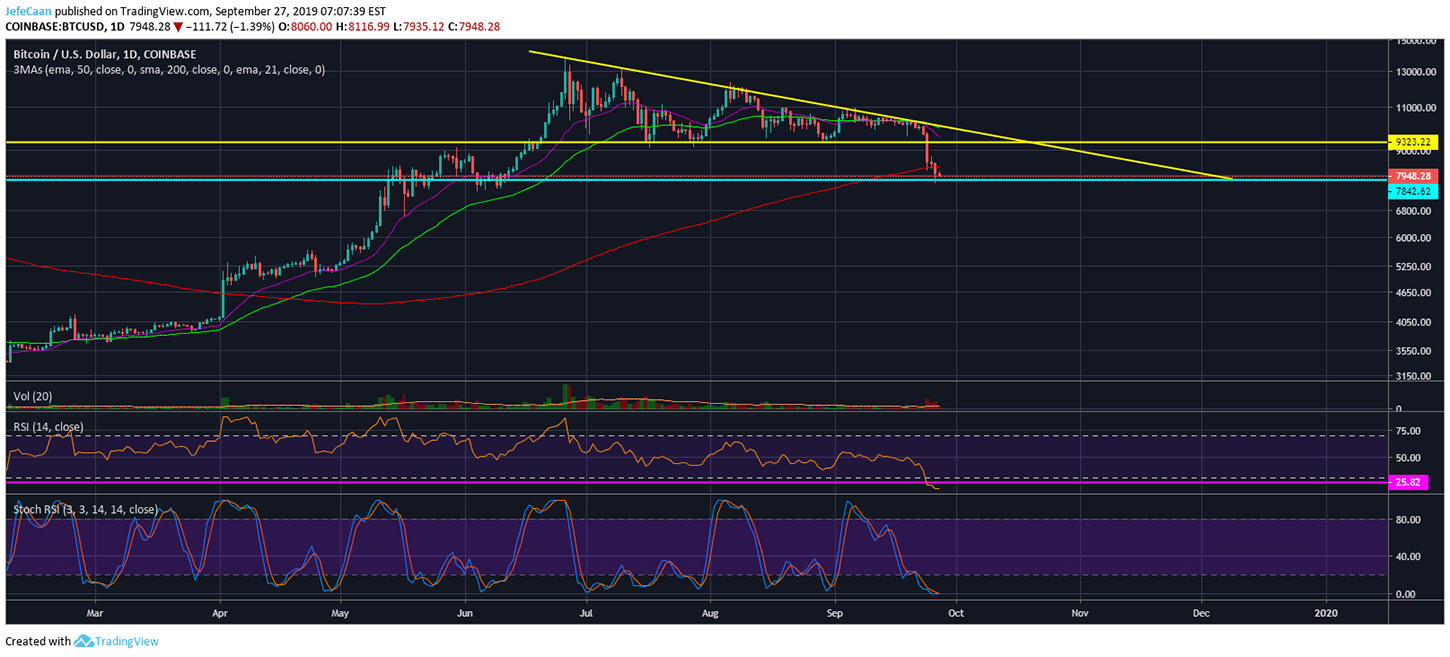
Bitcoin (BTC) correction may still not be over as bulls have failed to gain control. The price has been on a brutal decline for the past few days but there are still no signs of a recovery as we have seen a strong rejection at the 200 EMA on retest. The daily chart for BTC/USD shows that the price has broken a smaller descending triangle but now it is on the verge of breaking a larger descending triangle. That being said, I don’t expect it to happen when everyone is expecting it. Yesterday’s close below the 200 day EMA was quite bearish but we have yet to see the price begin another downtrend. So far it has been trading sideways and the longer it does that, the higher the probability that we might eventually see a breakout towards the low $9,000s.

There is a very high probability that the price might end up testing the previously broken support turned resistance of the descending triangle. This would be the ideal scenario and it would also make the BTC/USD daily chart a lot more symmetrical. We have seen how rise and fall in BTC/USD have been mirror images of each other in the past few weeks. It might be time that we see that happen on a larger time frame now. If we see a move towards $9,323 from here that would support our long term view of the market and we would see the beginning of the next downtrend from there. At this point, a lot of traders have very diverse opinions as to what could happen next. Some expect the price to fall below $3,000 while others that believe that the price has already bottomed think we might begin a recovery from $6,000 towards a new all-time high.
I have long been expecting the price to decline below $3,000 to complete its correction. I have been looking at the $1,200-$1,800 range as the potential bottom but I’m open to the price finding a bottom between $1,800 and $3,000 under a less bearish case. It is still premature to comment on what will happen when the price does decline below $3,000 but recent moves in the market should convince you that you shouldn’t be surprised even if Bitcoin (BTC) falls down to $1,000 or even lower.
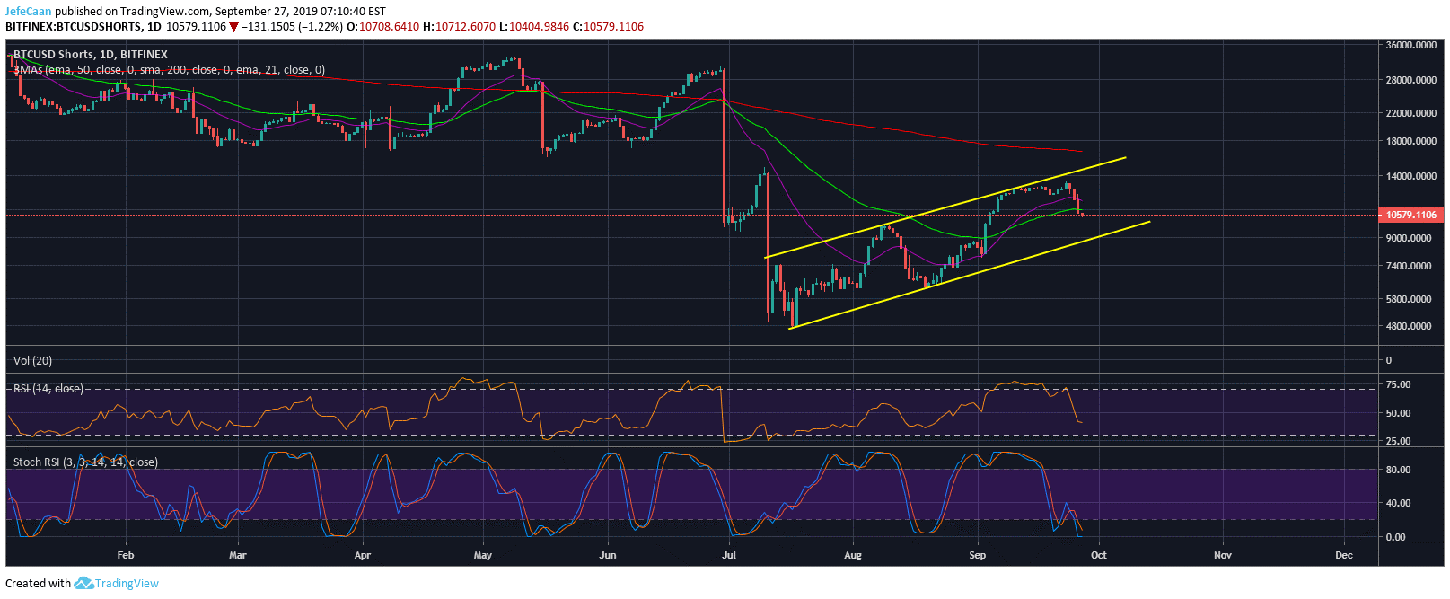
The daily chart for BTCUSDShorts shows a bear flag in the making. The number of margined shorts has been rising as the price of Bitcoin (BTC) rallied. After September 24 when the price of Bitcoin (BTC) started to decline, we saw BTCUSDShorts decline as well as traders took profits. If we are to see some short term bullishness in the market like I expect then BTCUSDShorts might rise again but we need to stay focused on the bear flag here because this tells us that a major crash in the price of Bitcoin (BTC) could be around the corner which would coincide with traders closing shorts or their take profit levels being hit.