Why This Could Be The Worst Time In History To Buy Bitcoin (BTC)
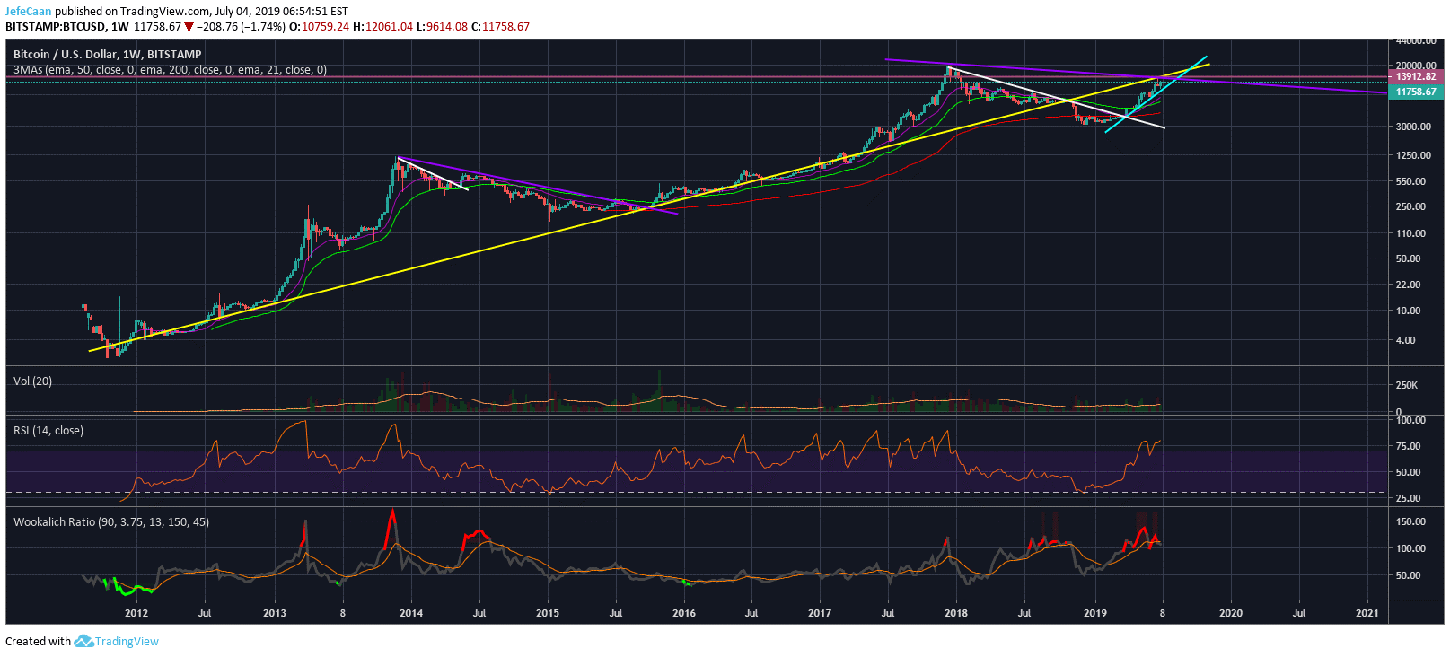
This could be the worst time in history to buy Bitcoin (BTC) and this analysis we are going to explore why. First of all, let us look at some basic structures on the weekly chart for BTC/USD. Starting with keeping thing simple, we see one critical trend line that goes back to 2011. This trend line served as support since 2011 and had not been breached once until November, 2018. This was a strong trend line support which means that now it will be a strong trend line resistance. We have already seen proof of this as the price faced a strong rejection when it ran into this trend line. Now, this clearly shows that as long as this long term trend line is breached to the upside, there is no reason at all to be bullish on Bitcoin (BTC) but we have other reasons to think this might actually be the worst time to be bullish on Bitcoin (BTC).
Before coming to the complex technicals or patterns that could be interpreted in different ways, let us first discuss the things that cannot be interpreted in many ways. One of those things is the duration of market cycles. If we take a look at this chart, we can see that market cycles have kept on expanding. It makes every bit of sense that this would happen because if more money goes into the market, it takes more time to get that money out of the market. This is not just about Bitcoin (BTC), we have seen this happen in other markets as well. If we acknowledge that market cycles will keep on expanding, then we should have a longer cycle this time compared to the previous cycle. However, this is not what most of the people who think BTC/USD has bottomed believe. In fact, they so conveniently chose to believe that the ongoing bear market has lasted only lasted 476 days compared to the previous bear market that lasted 679 days. Furthermore, if we look at the weekly chart again, the sell signals on the Wookalich Ratio indicator are quite obvious and require no explanation.
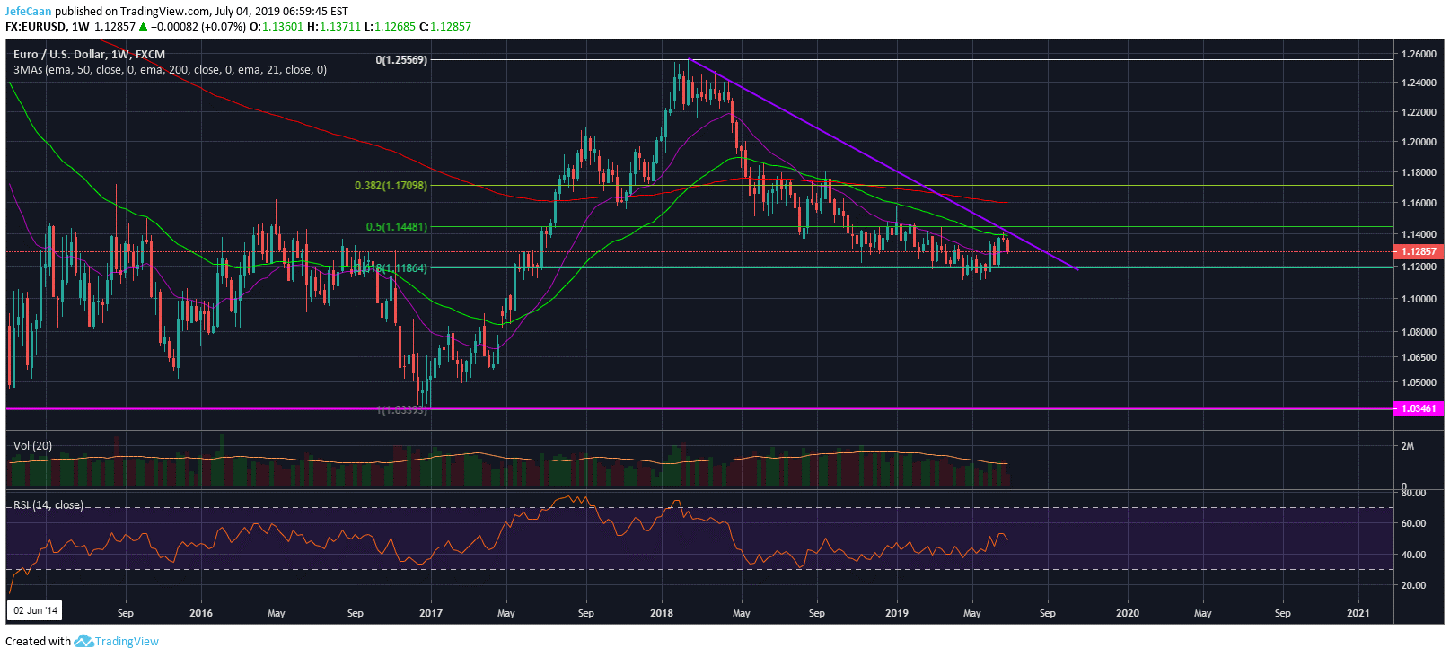
Now, let us take a look at the bigger market that BTC/USD answers to. The weekly chart for EUR/USD shows that we are very closely to the Euro breaking to the downside against the US Dollar. Recently, Christine Lagarde just got tapped as the next President of the European Central Bank. She has previously been the Head of the International Monetary Fund (IMF). It is very likely that her policies are going to be more in line with that of the US government. A lot of media outlet have already published posts on “Christine Lagarde: good for the ECB, not so good for the Euro”.

The descending triangle that we see on EUR/USD can break to the downside anytime now. The weekly RSI supports such a decline and this is in line with our expectations as we see the pair declining towards the end of the year, probably all the way to the middle of next year. This coincides with our thoughts on BTC/USD as well because we expect the price to continue to decline till the next halvening as it did during the last halvening. After the June, 2020 we expect a minor relief rally followed by sideways movement. There is a good chance that BTC/USD might have bottomed by then but it will still trade sideways for a long time before it begins another bullish cycle.