Sally Ho's Technical Analysis 20 July 2019
Bitcoin
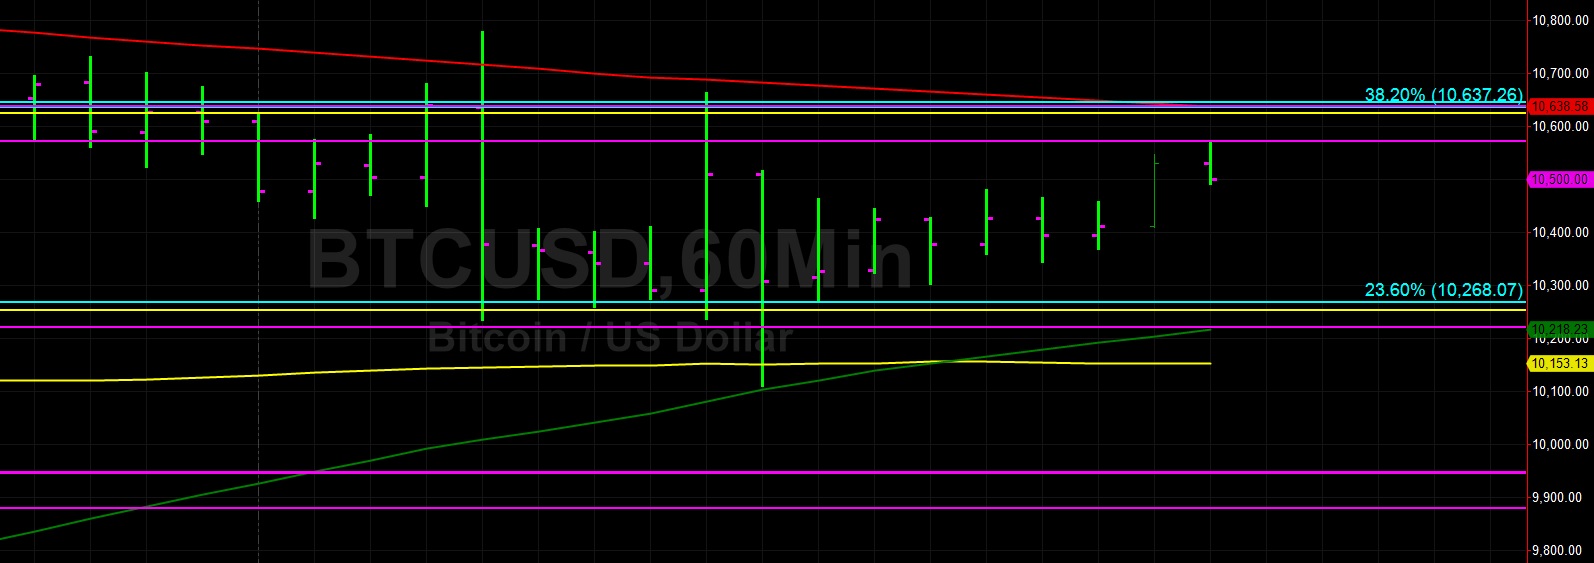
Bitcoin (BTC/USD) encountered some slight buying pressure early in today’s Asian session as traders lifted the pair to the 10,457.00 level after Bids emerged around the 10,111.00 area during yesterday’s North American session, just above the 76.4% retracement of the move from 8,919.72 to 13,868.44. The next upside retracement targets related to this range are the 10,810.13 and 11,394.08 areas. Minor Stops were elected above the 10,649.28 area during yesterday’s Asian session, representing the 38.2% retracement of the move from 13,202.63 to 9,071.00.
The pair encountered some technical Resistance around the 50-bar MA (4-hourly), however, and then had problems breaking above the 10,810.13 area. Traders are interested to see if BTC/USD can eclipse the 11,136.82 area, the 50% retracement of the aforementioned 13,202.63 – 9,071.00 range. Before it is able to test that level, however, chartists are eyeing some technical Resistance around the 10,958 and 11,091 areas. Also, the 200-bar MA (4-hourly) is currently indicating around the 10,933.32 area and the 100-bar MA (4-hourly) is currently indicating around the 11,187.22 level.
Price activity is nearest the 50-bar MA (4-hourly) at 10,626.39 and the 200-bar MA (Hourly) at 10,644.22.
Technical Support is expected around 10,046.06/ 9,532.39/ 9,071.00 with Stops expected below.
Technical Resistance is expected around 11,136.82/ 11,510.44/ 12,227.57 with Stops expected above.
On 4-Hourly chart, SlowK is Bullishly above SlowD while MACD is Bullishly above MACDAverage.
On 60-minute chart, SlowK is Bullishly above SlowD while MACD is Bearishly below MACDAverage.
Ethereum
Ethereum (ETH/USD) made strides higher early in today’s Asian session as the pair traded as high as the 220.86 area after finding Bids around the 213.15 area during yesterday’s North American session. ETH/USD continues to orbit the 220.44 area, representing the 23.6% retracement of the move from 318.63 to 190.11. The pair’s next upside retracement levels related to this range include the 239.20 area followed by the 254.37 area.
During yesterday’s European session, the pair tested the 226.56 area, a relative low from 9 June. Chartists are closely watching the 229.46 area, an important area that was tested during yesterday’s Asian session that represents the 61.8% retracement of the move from 146.00 to 364.49. The next upside level related to that range is the 255.25 area. Before advancing to some of these upside areas, however, the pair must get through technical Resistance around the 235 – 236 area. Also, the 246.88 area remains a key longer-term price objective.
Price activity is nearest the 50-bar MA (4-hourly) at 236.32 and the 50-bar MA (Hourly) at 218.88.
Technical Support is expected around 206.18/ 183.33/ 165.25 with Stops expected below.
Technical Resistance is expected around 236.43/ 257.22/ 272.56 with Stops expected above.
On 4-Hourly chart, SlowK is Bearishly below SlowD while MACD is Bullishly above MACDAverage.
On 60-minute chart, SlowK is Bullishly above SlowD while MACD is Bearishly below MACDAverage.
