SOL ETF Flows: Is Solana Becoming the Altcoin Rotation Trade After Bitcoin’s GBTC Drag?

Across the last stretch of May, something unusual showed up on the tape: U.S. spot Bitcoin ETFs bled for nine straight sessions just as U.S. spot Solana ETFs logged their strongest month since launch. Desks started asking a pointed question—are allocators quietly rotating into SOL?
Flow data doesn’t prove a grand regime shift, but it does hint at a tactical pivot. If Bitcoin’s GBTC overhang has reasserted itself, Solana may be inheriting some of the risk-on bid through its new spot ETF wrappers.
Before anyone upgrades “rotation” to a foregone conclusion, it’s worth unpacking what the flows actually say, who is driving them, and what could interrupt the trend.
Editor's note: On my tracking book, the timing of SOL creations lined up with tighter spreads in the leading product and a noticeable firming of perps basis. Conversations with allocators framed it as a second sleeve, not a BTC replacement—more of a momentum and access trade than a conviction bet. That said, two of those desks pulled back size when funding pushed up, reinforcing that this rotation is tactical and lever-sensitive, not a set-and-forget shift. — Idris Calloway
Two things happened in May 2026 that set the stage. First, U.S. spot Bitcoin ETFs registered nine consecutive trading days of net outflows between mid and late May, with roughly $2.8 billion drawn down across the stretch, according to CoinDesk. Second, U.S. spot Solana ETFs posted their best month since launch, adding $115.3 million of net inflows and pushing cumulative category AUM to about $1.13 billion by month-end, per the Solana Foundation.
When the market’s benchmark asset loses marginal demand at the same moment a higher-beta alternative gains a convenient wrapper, even modest reallocations can look like a narrative “rotation.”
CoinShares’ weekly flows cemented the juxtaposition: for the week ending May 18, digital-asset investment products saw $1.07 billion in outflows, with Bitcoin funds shouldering $982 million of that—while Solana products took in $55.1 million, per Advisor Perspectives (CoinShares). The question is whether this is tactical rebalancing or the beginning of a durable allocation pattern.
From GBTC Drag to Rotation: Why SOL?
Even after the spot-ETF era began for Bitcoin, legacy GBTC supply dynamics and periodic redemptions have remained a recurring headwind. When that drag flares, allocators with risk budgets intact often scour for relative momentum in liquid alternatives.
Structural flows vs. price chasing
SOL benefits from a new, regulated wrapper that many RIAs and funds can actually buy, potentially gating some of the demand that previously bled into offshore venues. If certain desks are trimming BTC exposure due to macro chop or GBTC-related pressure but still want crypto beta, a SOL ETF offers a compliant bridge.
Narrative premium
Rotation isn’t just about “what’s down—what’s up.” It’s also about a credible story. Solana’s positioning in high-throughput consumer applications and DeFi throughput gives allocators a fundamental narrative to underwrite, regardless of one’s personal view of its durability. The wrapper simply makes expressing that view operationally easier.
| Metric | Bitcoin ETFs | Solana ETFs |
|---|---|---|
| Late-May stretch | 9 consecutive outflow days; ≈$2.8B net out (May 15–28) | Strongest month since launch in May |
| Weekly snapshot (wk ending May 18) | −$982M (CoinShares) | +$55.1M (CoinShares) |
| May 2026 monthly net | Mixed to negative across majors | +$115.3M; category AUM ≈$1.13B by month-end |
Sources: CoinDesk, Advisor Perspectives (CoinShares), Solana Foundation.
How SOL ETFs Are Pulling Assets
Concentration is a defining feature of the SOL ETF category to date. Crypto Briefing reported that Bitwise’s BSOL drove roughly $80 million of May’s Solana ETF inflows and, by late May, captured about 81% of cumulative U.S. Solana spot ETF flows—around $916 million of the roughly $1.13 billion category total (CryptoBriefing).
Issuer concentration and liquidity
When one issuer dominates early flows, primary and secondary market liquidity can coalesce around that vehicle. That helps spreads tighten faster, which, in turn, can attract more mandates that have internal best-execution thresholds. The flip side is single-issuer concentration risk: changes to creation/redemption efficiency, fee schedules, or custody arrangements at the leader can affect effective access to the asset class.
Authorized participants and hedging
APs smoothing creations in a still-maturing SOL ETF market have a few levers—spot purchases on regulated exchanges, basis trades against futures where available, and OTC blocks. The cleaner the hedge and the deeper the liquidity, the more confident APs are in keeping NAV tightly in line with market prices.
Flow mechanics in brief
- Allocator submits a creation order via the issuer and AP network.
- AP sources SOL in the market or via OTC, delivering to the custodian in exchange for ETF shares.
- Secondary market trading reflects demand; if shares trade at a premium/discount, AP arbitrage nudges price back toward NAV.
- Over time, tighter spreads and lower premiums/discounts lower total cost of ownership, potentially drawing more systematic flows.
Because the SOL ETF wrapper is new, each marginal improvement in execution quality can unlock mandates that were waiting for adequate liquidity history.

On-Chain and Market Microstructure Clues
ETF flows don’t live in a vacuum. They tap into a broader market structure that includes spot venues, perpetual futures, and staking dynamics. Without relying on any single metric, here are the signposts professionals often track to contextualize flows:
Basis and funding
When ETF inflows rise alongside stable or moderately positive funding rates and a contained futures basis, it suggests demand is being absorbed without excessive leverage. Conversely, sharp positive funding and a widening basis may indicate speculative froth piggybacking on ETF prints.
Order book depth and slippage
Improvements in top-of-book depth on major USD and USDC pairs, coupled with lower slippage on simulated blocks, hint that APs can scale creations without introducing large tracking errors. That directly affects how attractive the ETF is to programmatic allocators.
On-chain activity
For a network narrative like Solana’s, trends in fee spend dispersion, active addresses tied to real applications, and DeFi liquidity utilization provide context. These are not guarantees of price outcomes, but they can reinforce allocator conviction if they improve while ETF assets grow.
None of these indicators should be used in isolation. The goal is triangulation: do derivatives, spot market quality, and on-chain traction rhyme with what the ETF tape is telling you?
Who Is Buying SOL ETFs—and Why Now
It’s tempting to imagine a single “rotation whale” steering flows, but the buyer base is usually a mosaic.
Multi-asset managers with crypto sleeves
Some managers that received approval to hold Bitcoin ETFs are extending their mandate to a second exposure—often a capped percentage of AUM dedicated to a non-BTC asset. The case for SOL is straightforward: differentiated tech stack and, crucially, a compliant ETF rail.
Wealth platforms and RIAs
Once due diligence teams approve a product list, model portfolios may introduce a small SOL sleeve as a satellite position. Even a 50–100 bps allocation in balanced portfolios can produce tens of millions in flows when scaled across large platforms.
Crypto-native arbitrage and basis desks
ETF prints create dislocations across spot, perps, and futures curves. That invites relative value trades that can indirectly support ETF liquidity, even if these desks are not “directional long SOL.” Their activity still helps stabilize premiums/discounts.
Retail via brokers
A regulated ETF wrapper is a simpler button-click for many retail investors compared with managing wallets and exchange risk. While retail flows are often pro-cyclical, the low-friction access matters for momentum phases.
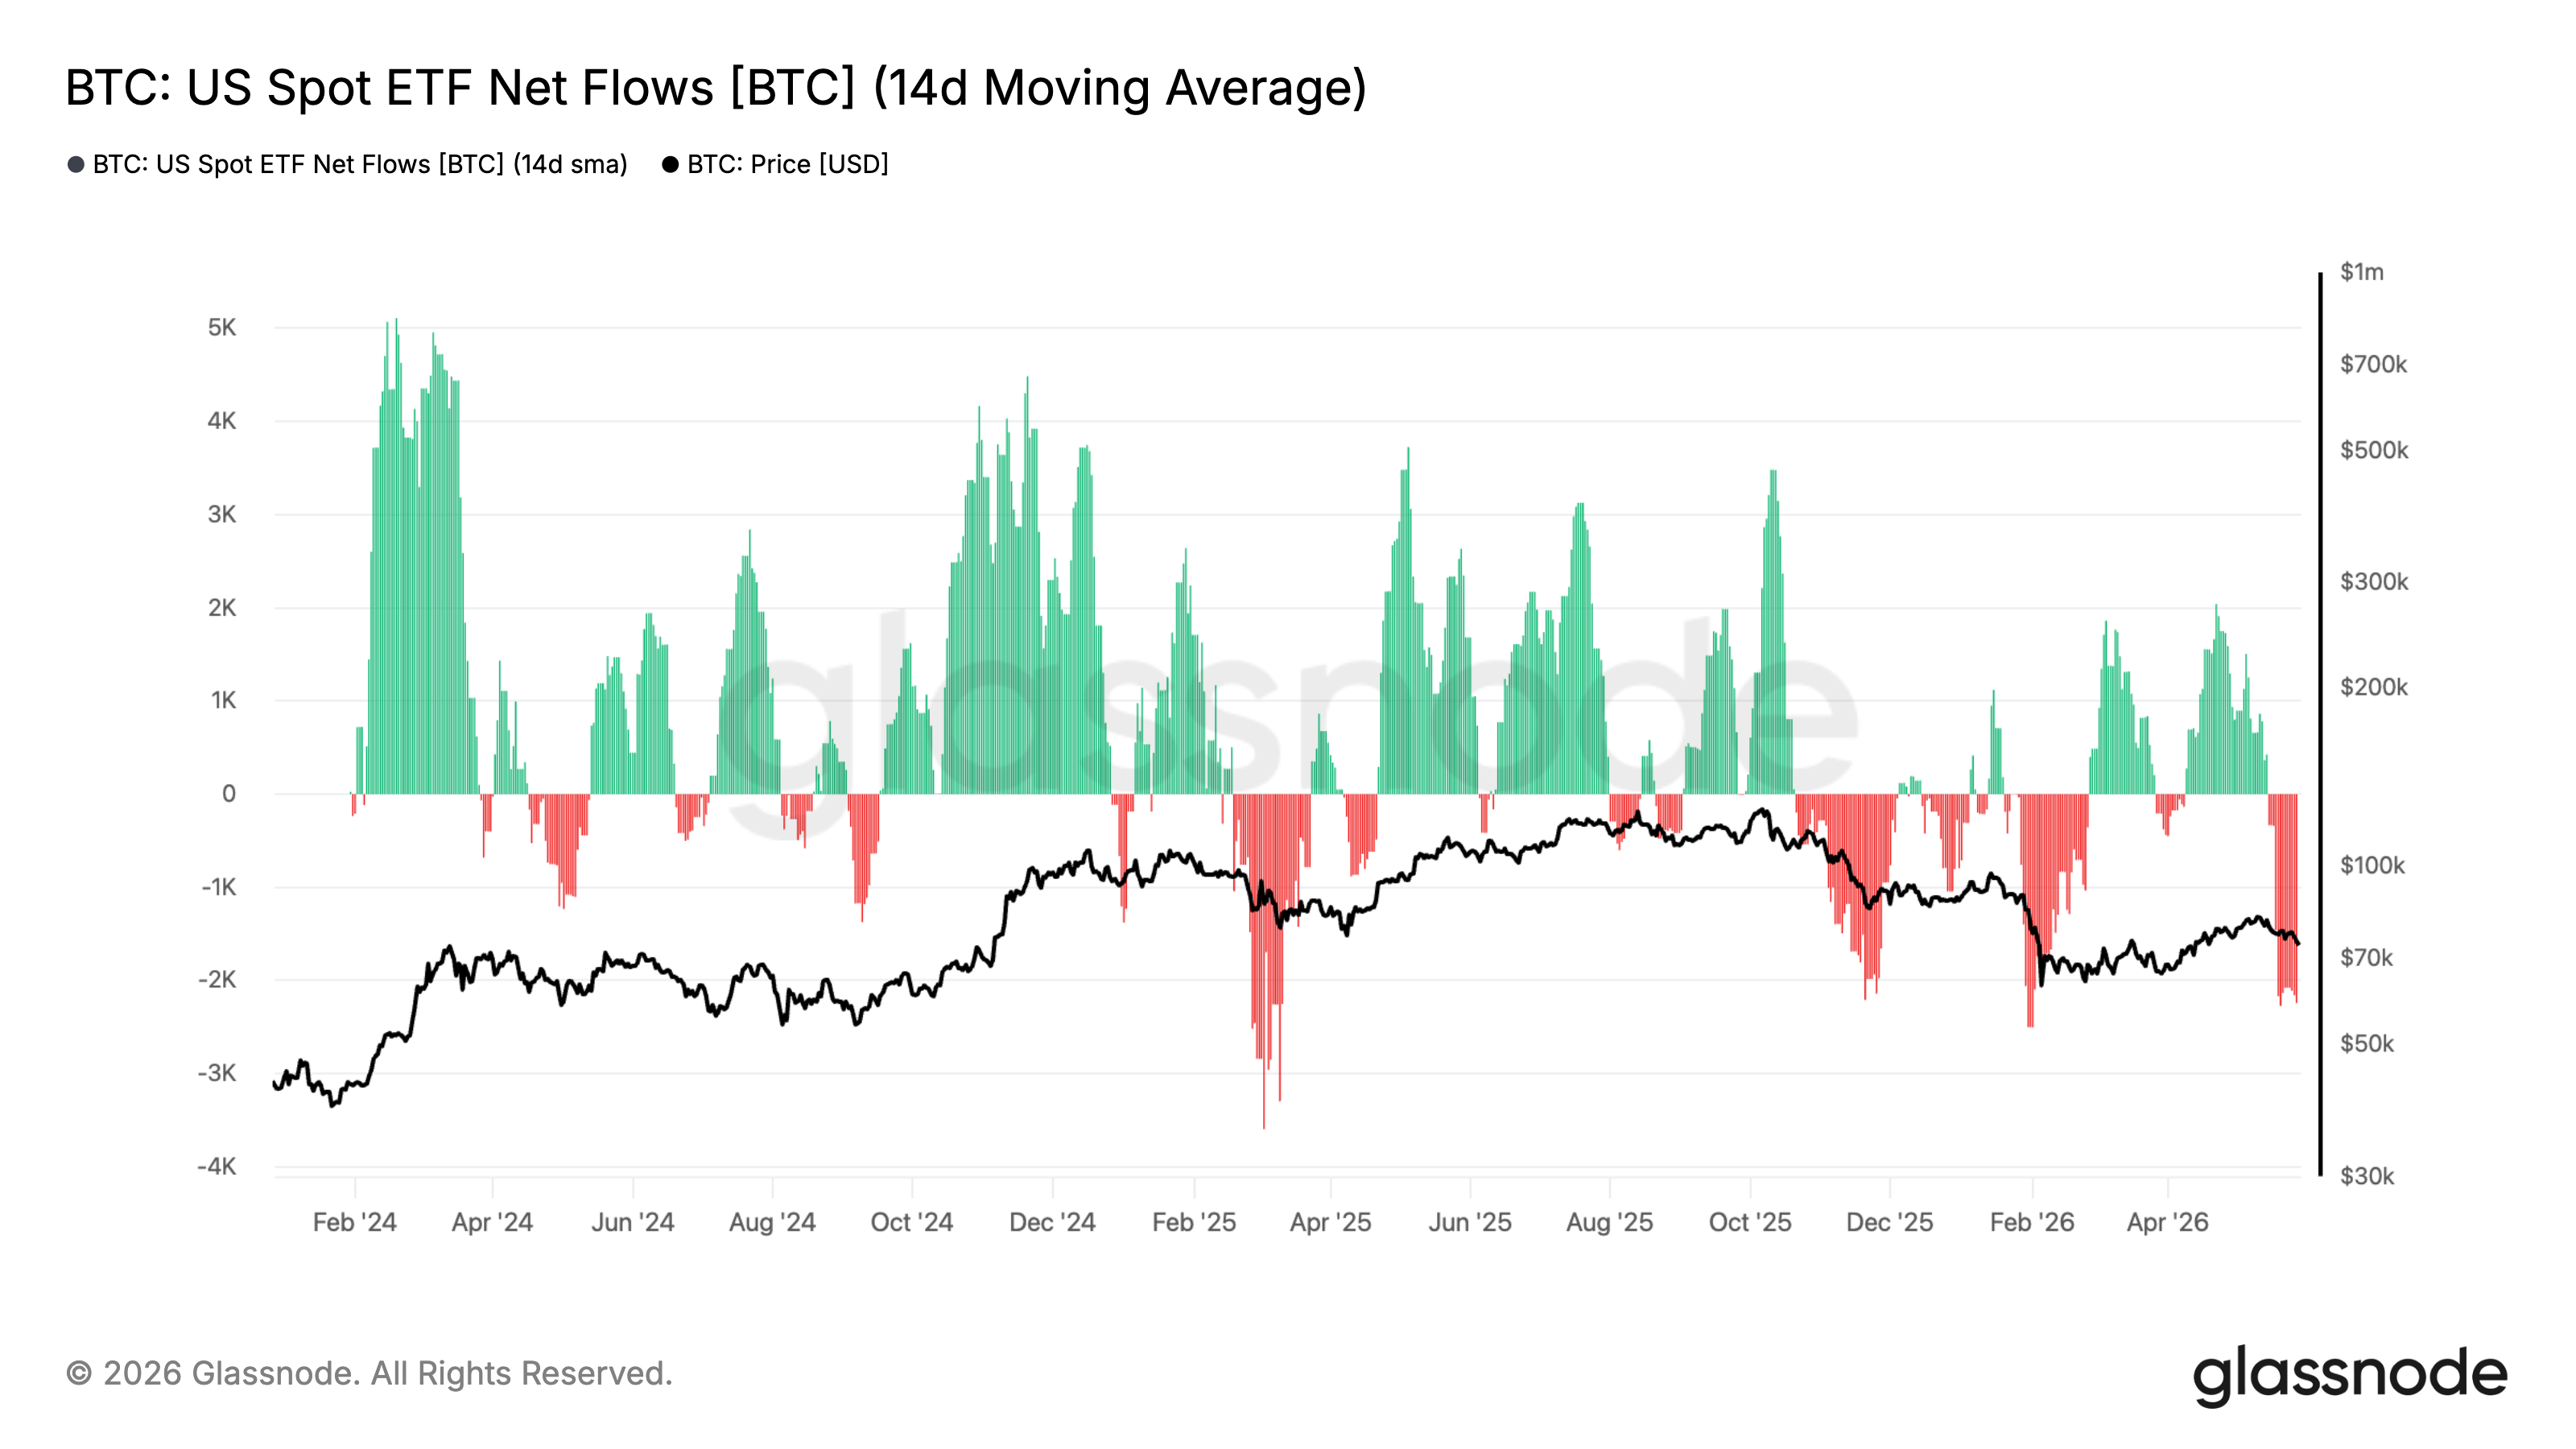
Glassnode chart of BTC US spot ETF net flows (14‑day MA) with BTC price—shows the late‑May 2026 outflow streak that helped create selling pressure on BTC and a potential institutional reallocation toward altcoins like Solana. — Source: Glassnode (chart hosted on CoinDesk)
Scenarios for the Next Quarter
With the May flows as a backdrop, what are the plausible near-term paths?
1) Rotation persists, but tapers
Bitcoin ETF outflows stabilize, but the absence of a strong positive catalyst keeps BTC in a range. SOL ETFs continue to gather assets—helped by issuer concentration and improved spreads—but at a more moderate cadence than May. This would look like healthy, incremental adoption rather than a euphoric chase.
2) BTC reasserts leadership
An improvement in macro conditions, a large institutional allocation, or the abatement of GBTC-related selling refocuses flows back to Bitcoin. In this case, SOL ETFs may still grow, but the rotation narrative fades as cross-asset beta tightens.
3) Risk-off hits all of crypto
Exogenous shocks—regulatory headlines, liquidity stress, or macro volatility—lead to redemptions across the board. SOL’s higher beta works in both directions, and ETFs could see outflows alongside BTC as allocators reduce overall crypto exposure.
None of these paths are mutually exclusive over a quarter; markets often sample from each playbook in sequence.
Risks & What Could Go Wrong
- Correlation shock: In stress, altcoins often correlate tighter to Bitcoin. A renewed BTC drawdown could drag SOL despite prior inflows.
- Regulatory shifts: Any adverse rulings, enforcement, or classification changes affecting SOL or its ecosystem could constrain ETF operations or demand.
- Liquidity air pockets: If one issuer dominates and an operational hiccup occurs, spreads could widen and tracking could degrade until liquidity redistributes.
- Network reliability: Technical outages or degraded performance on the underlying network can dent allocator confidence and catalyze ETF outflows.
- Derivative leverage: Elevated funding/basis powered by speculative positioning may unwind abruptly, pressuring spot and ETF NAVs.
- Custody and counterparty: Concentration in a handful of custodians or APs introduces operational dependencies that, if stressed, can impact creations/redemptions.
- Headline rotation reversal: A single large BTC inflow day or macro catalyst can flip the narrative quickly, whipsawing latecomers to the rotation trade.
Rotation trades are fragile: they work until they meet a stronger cross-current—usually macro, regulation, or a liquidity break.
For ongoing context, institutional readers often pair primary data with independent analysis. Outlets like Crypto Daily track ETF prints, issuer updates, and on-chain shifts to separate structural flow from headline noise.
Frequently Asked Questions
Is Solana really attracting fresh money while Bitcoin bleeds?
In May 2026, yes—at least in the ETF channel. U.S. spot Bitcoin ETFs recorded nine consecutive outflow days totaling about $2.8 billion late in the month, per CoinDesk, while U.S. spot Solana ETFs posted about $115.3 million of net inflows in May and roughly $1.13 billion of cumulative AUM by month-end, per the Solana Foundation. Weekly data from CoinShares also showed Bitcoin outflows and Solana inflows in mid-May.
Is this a true “rotation” from BTC to SOL or just noise?
It’s too early to declare a structural rotation. The flows could reflect tactical rebalancing amid GBTC-related pressure and macro uncertainty. If Solana ETFs continue to gather assets through different market regimes—not just when BTC stumbles—that would strengthen the case for a sustained allocation shift.
Which issuer is leading Solana ETF flows?
Crypto Briefing reported Bitwise’s BSOL contributed about $80 million of May inflows and had captured approximately 81% of cumulative U.S. Solana spot ETF flows by late May (around $916 million of $1.13 billion). Concentration can improve liquidity in the leading fund but introduces single-issuer dependency risks.
What metrics should allocators watch to judge the health of SOL ETF demand?
Beyond net creations/redemptions, watch secondary market spreads and volume, ETF premium/discount to NAV, on-chain utilization trends, and derivatives signals (funding, basis, and open interest). A healthy picture shows steady creations, tight spreads, modest premiums/discounts, and contained leverage.
Could SOL decouple from BTC if the rotation continues?
Short periods of relative strength are possible, especially around idiosyncratic catalysts and wrapper-driven demand. Over longer horizons, crypto assets often remain correlated, particularly in risk-off episodes. Decoupling should not be assumed as a base case.
Are there unique risks to SOL ETFs versus BTC ETFs?
Yes. Higher beta and thinner institutional depth can amplify moves. Network reliability and ecosystem concentration risks are more salient. Issuer concentration is also higher in SOL ETFs currently, which can affect liquidity and tracking during stress.
What could invalidate the rotation narrative fastest?
A sharp reversal of Bitcoin ETF outflows—say, a large institutional print—would likely re-center flows on BTC. Regulatory surprises or a technical incident on Solana could also reverse sentiment quickly.
Disclaimer: This article is provided for informational purposes only. It is not offered or intended to be used as legal, tax, investment, financial, or other advice.

Related Stories