How High Can Bitcoin (BTC) Go During The Next Bullish Advance?
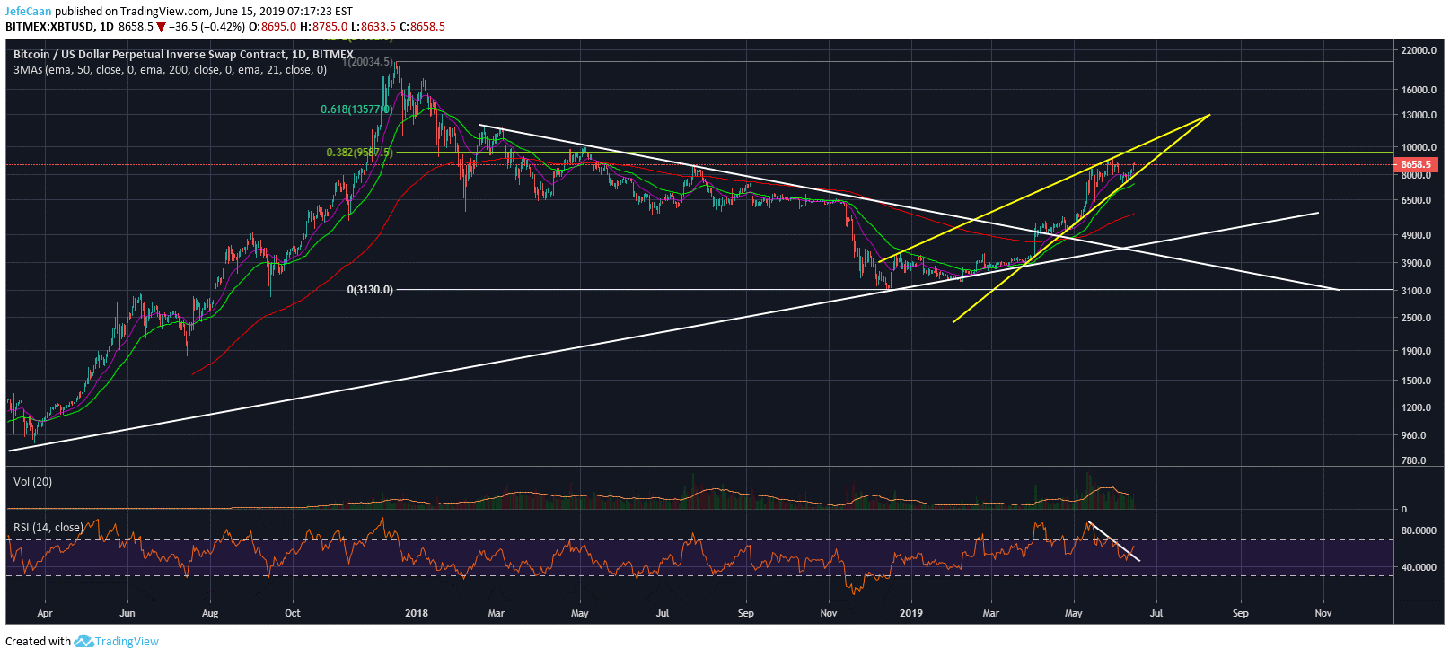
Bitcoin (BTC) is back above $8,600 and now eyes further upside. This has left a lot of analysts and investors speculating as to where BTC/USD might finally top out. There is no denying that Bitcoin (BTC) has been on a roll for the past few months but this rally will come to an end and that end is going to be brutal, not just for the bulls but also for the bears. Many retail bears have tried to get in front of the recent rally and most of them got liquidated but there are still some retail bears left to hunt before the downtrend can begin. The daily chart shows that the price took off soon as it found support at the bottom of the rising wedge and is now likely to rally towards the top.
As we can see, there is plenty of room to rally within this rising wedge. BTC/USD might even rally past $10,000 but it is highly unlikely to break past $11,000. There are a number of reasons why that may not happen. First of all, there is a strong resistance at $9,587 which is the 38.2% fib retracement level from the all-time high. The last time BTC/USD tested the 38.2% resistance from the ATH of the previous cycle, it ended up declining soon afterwards to begin a long downtrend. So, there is no reason to think this time will be different which is why the price may not rally much above that mark. Second of all, the $10,000 mark is a strong psychological level which means a lot of investors might be waiting to sell there. However, it is also likely that a lot of retail bears have their stops around that mark. This is why we might see a wick slightly above $10,000 but the price is extremely unlikely to close above $10,000.
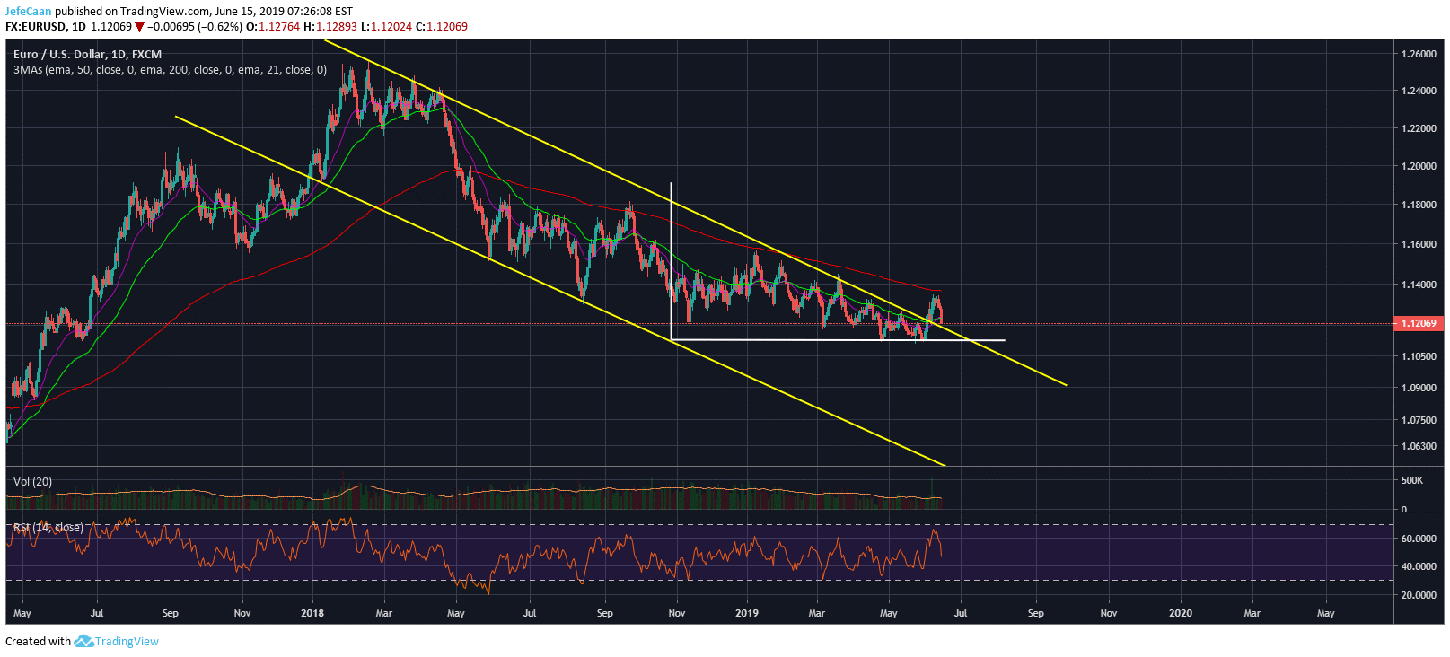
The daily chart for BTC/USD gives us ample reasons to think that the price may not end up rallying much higher above the $9,600 mark before it tops out. However, there are other reasons to believe why that may not happen. If we look at the daily chart for EUR/USD we can see that it has been in a strong downtrend since early 2018. EUR/USD has been declining within a descending channel but recently it broke the downtrend, rallied above it, and stopped just below the 200 Day EMA.

If we look at this chart, EUR/USD broke the descending channel to form a local top just below the 200 Day EMA and has now closed the last day of the week below the 50 Day EMA. In addition to that, the price has now closed below the 50 Week EMA for two consecutive weeks. These are all bearish signs that tell us that the break above the descending channel was most likely a fake out. We might see EUR/USD struggle to break past the 50 Day EMA next week which might give BTC/USD more time to complete its rally because once EUR/USD begins its next downtrend, Bitcoin (BTC) is not likely to stand its ground for much longer.