Bitcoin (BTC) Tests $12,000 Again As Bulls Push For Control
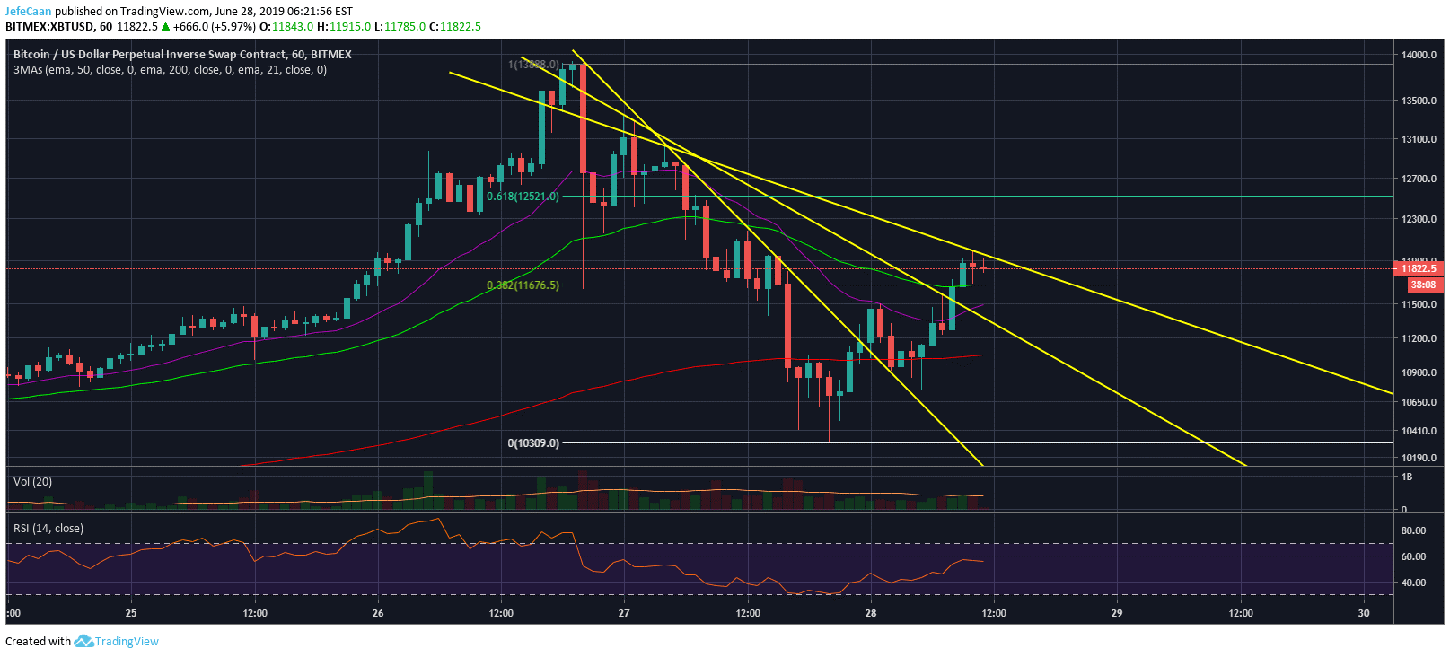
Bitcoin (BTC) shot up from $10,300 and has now tested the $12,000 mark again. The price has faced a minor rejection at a trend line resistance but we expect this to be broken eventually. The price found support atop the 38.2% fib retracement level and now it is eyeing a break past a trend line resistance to rally towards the 61.8% fib retracement level. This is a bullish development for BTC/USD short term and traders who noticed how much this 1H chart resembles the monthly chart of BTC/USD for the downtrend might have been able to profit off this rally. Just like the monthly chart though, the price is expected to top out soon as it reaches $12,521. Rallies like these will be seen over and over again now to give retail traders more reasons to buy the dip.
The price remains very bullish short term and there is no reason to get in front of this rally. However, that being said the big picture is what it is and it remains unchanged by this. We expected this move when the price found a temporary bottom around $10,300 after a devastating decline. The price will decline again and more hodlers will be caught holding their bags as the whales dump on them. This volatility that we see in the price is likely to be seen for a while as this is a key turning point and when BTC/USD closes the month below the major trend line support turned resistance, we will see the beginning of a new downtrend that is going to continue till the next halvening. We might see a bounce immediately after the halvening in June, 2020 but BTC/USD has to go down below $3,000 long term.
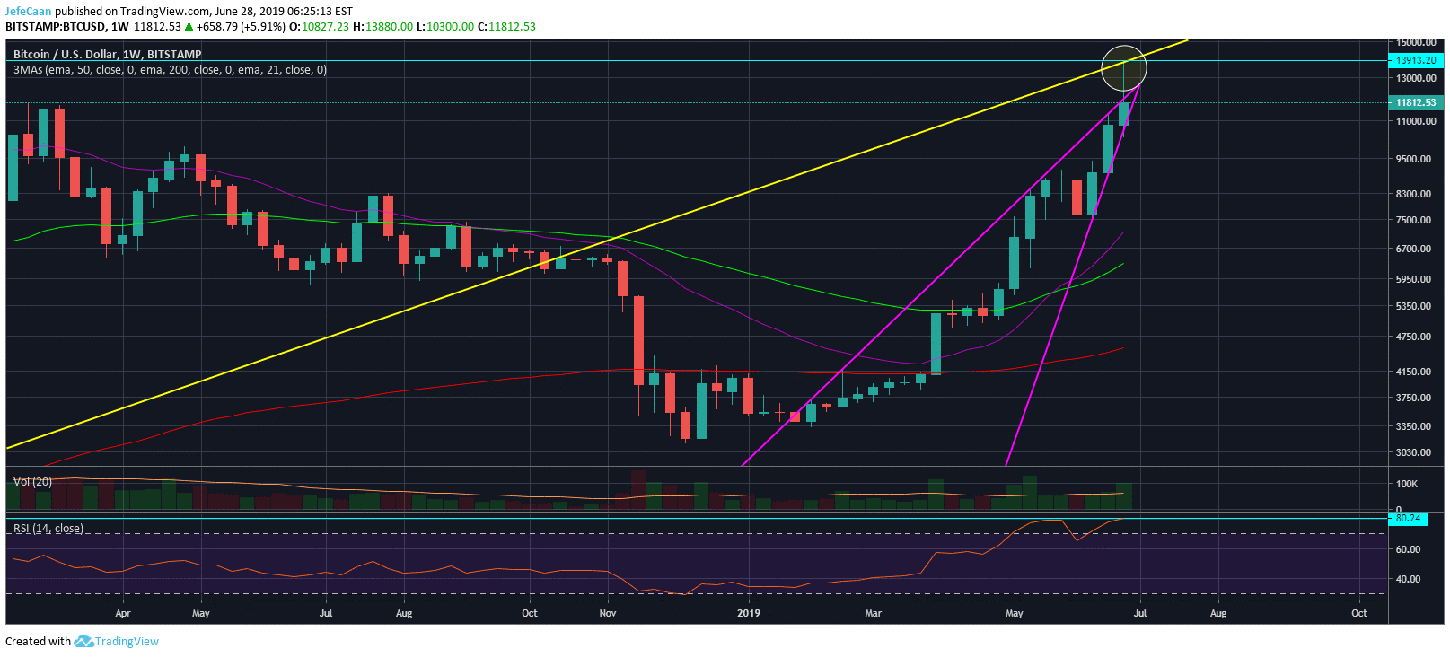
This is the big picture for Bitcoin (BTC). The weekly chart for BTC/USD shows two major bearish developments. The first one is a rejection at a critical trend line support turned resistance. This trend line served as support since 2011 until it was broken last year in November. It has now become a strong resistance and we have seen the price face a strong rejection after testing this line. The second bearish development is that the price is trading within a large rising wedge and is extremely likely to break to the downside as early as next week.

The weekly chart also shows that the RSI has topped out and we might see the beginning of a new downtrend from here as early as next week. The Fear and Greed Index shows that the bullish sentiment has taken quite a hit as the index is down by 30 points from 92 to 62. Some retail bears expect to fall from here in the same manner that it did during the past 24 hours but this is not how it happens. We will see a systemic decline in the price in such a way that retail bulls will keep on having hope of a bullish reversal until there is none left.