Bitcoin (BTC) Longs Are Exactly Where Market Makers Want Them To Be
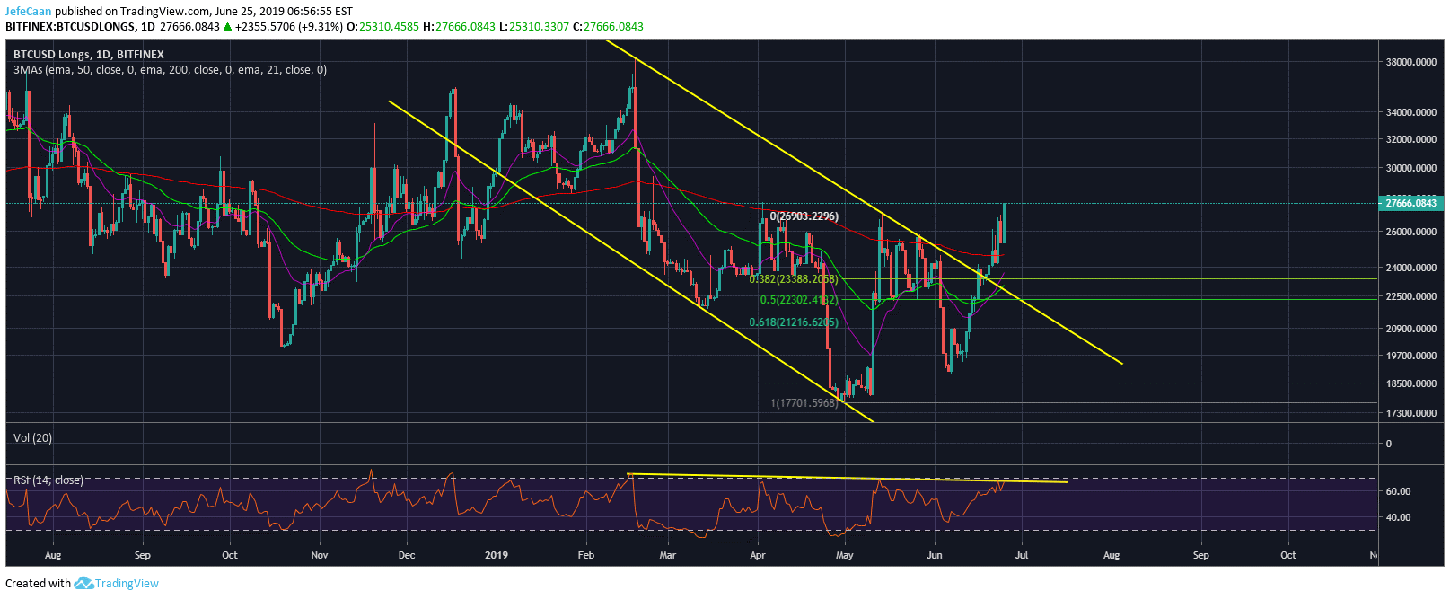
Bitcoin (BTC) Longs began their downtrend around the beginning of the year but since the recent rallies, the bulls have become more confident and we have seen BTCUSDLongs surge again. If we look at the daily chart for BTCUSDLongs, we can see that it has broken the downtrend and is currently up more than 9% for the day. This tells us that bullish euphoria is around extreme levels. Certainly, this could push the price higher towards $12,000 or even higher but there is no denying that this is going to end really, really bad. The people who are trying to long Bitcoin (BTC) on margin at this point are mostly those that did not expect this rally in the first place.
Now, when you get lucky and there is no play, the best thing to do is to take your money and leave the casino. However, that is not so easy in this market when a lot of popular ‘industry leaders’ have you believe otherwise. If you think this is happening for the first time, you should check their tweets or statements from before. It is all quite simple. They did not get where they are by being stupid. So, you cannot possibly think that most of these people with a large following that keep on selling free hopium will stay in this market and hold their coins like they want you to do. They want you to hold your coins so they can dump on you. Then when your portfolio ends up losing 95% of its value, they tell you, “one Bitcoin will always be one Bitcoin”.
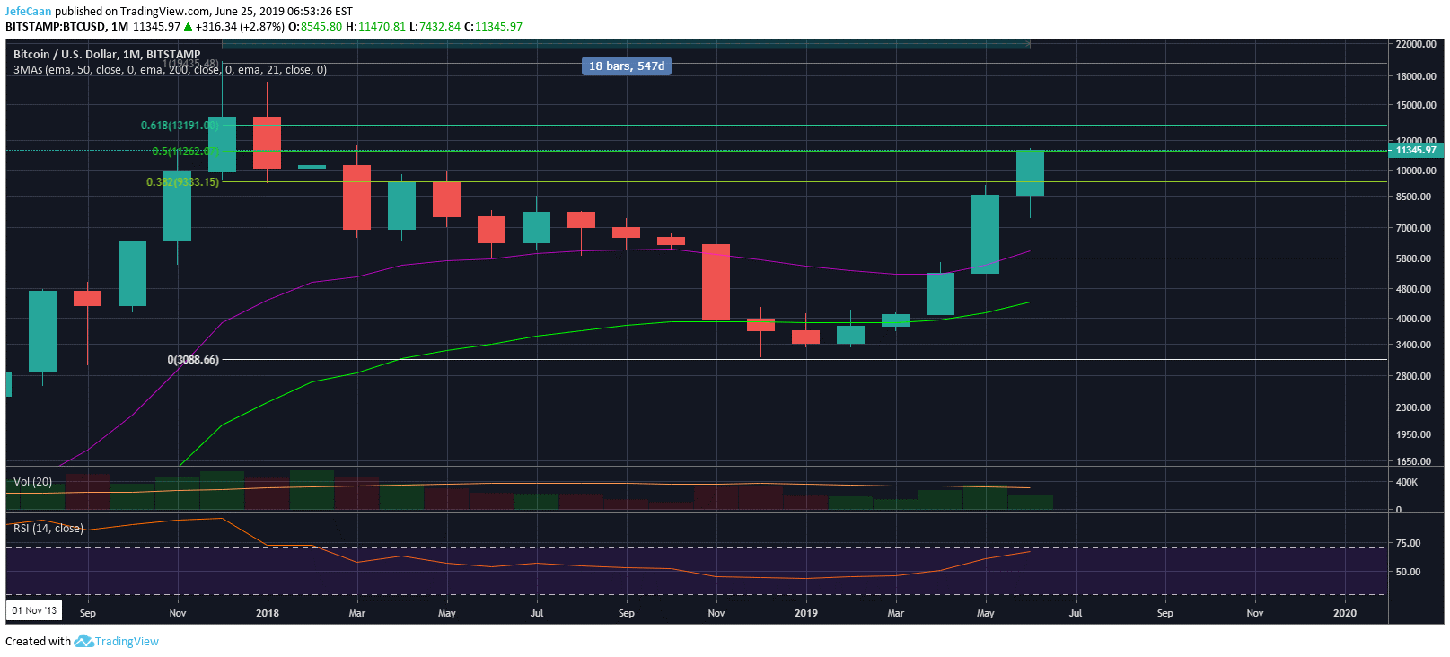
A lot of people in this market do not like bearish opinions so I’ll just stick to the facts. If we look at the monthly chart for BTC/USD, we see that Bitcoin (BTC) has rallied for five months straight. Do you really think this could go on without a pullback? Even during the bull run of 2017, the price did not rally for more than five months without a pullback in between. If BTC/USD closes the month near current levels, it would have faced a strong rejection at the 50% fib retracement level. Technically, the 50% fib retracement level is not actually a Fibonacci level but it is sometimes used as a good indicator of trend continuation.

If BTC/USD closes below the 50% fib retracement level and starts to decline, this might be a sign of bearish reversal. Again, it is important to note that the price could rally even higher to test the 61.8% fib retracement level from ATH short term. However, it must be acknowledged that it was quite unusual for the price to have pierced through certain critical levels like knife through butter. This cannot continue for long and just as we saw the price began its downtrend from between the 38.2% and 61.8% fib retracement levels from ATH, we expect the same to happen during the ongoing cycle.