Bitcoin (BTC) About To End The Week In Red But Rally Towards $10k Still In Sight
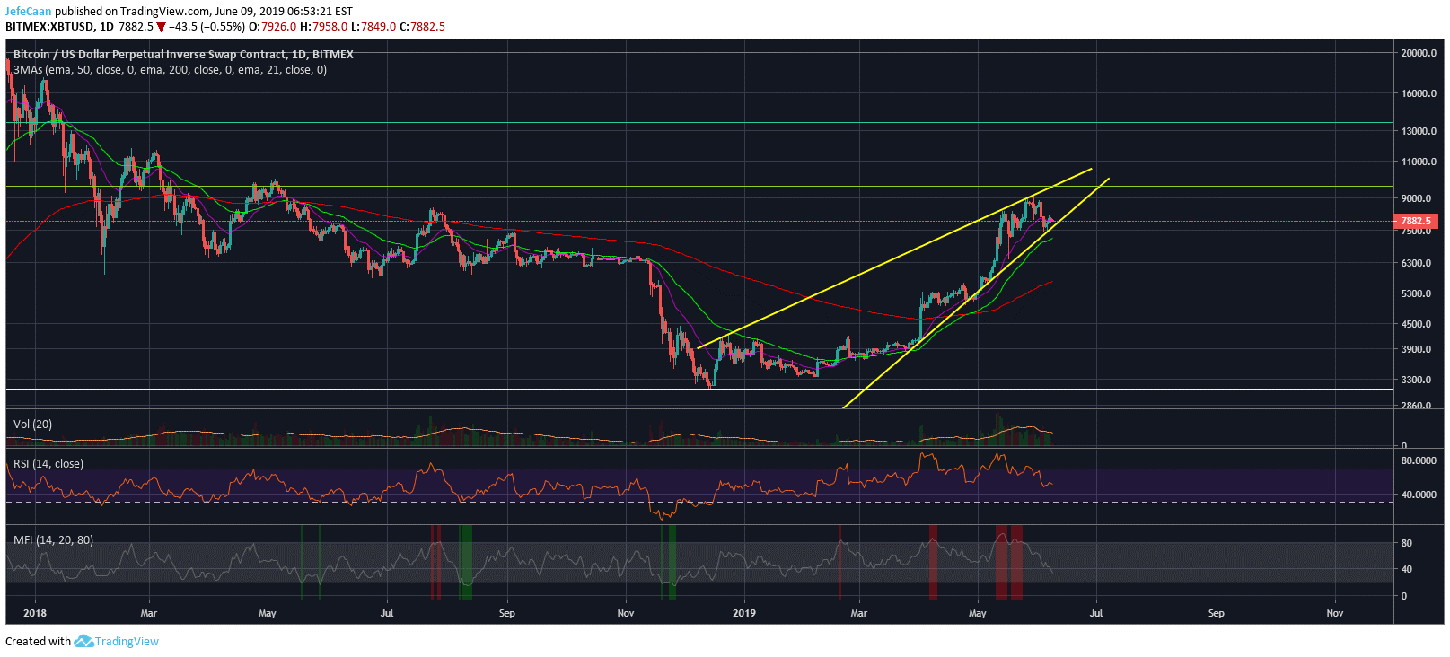
Bitcoin (BTC) is about to close the week in red for the first time in six weeks. The price has closed five weeks consecutively in the green as it rallied in a parabolic manner the past few months. Investors are now confused what this would mean for BTC/USD in the weeks and months ahead. Short term, this does not change much as a rally towards $10,000 is still in sight. The daily chart for BTC/USD shows that the RSI and MFI indicators now indicate that there is ample room for a rally to the upside. The price cooled off after an aggressive run up and is now likely to consolidate before its next big move to the upside. The likelihood of further downside at this point remains low as we do not expect BTC/USD to break the ascending wedge just yet.
The price is likely to keep on trading within this wedge as long as it does not touch the $9,600 level or the 38.2% fib retracement level from ATH. As the price attempts to test the 38.2% fib retracement level, it will have to climb atop the 21 day EMA. This level will then serve as a temporary support and the price will move sideways for a bit before declining below this level and eventually below the rising wedge. There is no denying that BTC/USD is due for a major correction long term but short term its bearish outlook has changed. The price has cooled off significantly and is now ready for another rally to the upside. Bitcoin (BTC) has yet to see maximum FOMO and I think we will see it soon as the price nears the $10,000 level. Previously, the $9,000 level was rejection strongly and the price ended up declining even below $8,000 after testing that level, but this time BTC/USD will be in a better position to retest that level.
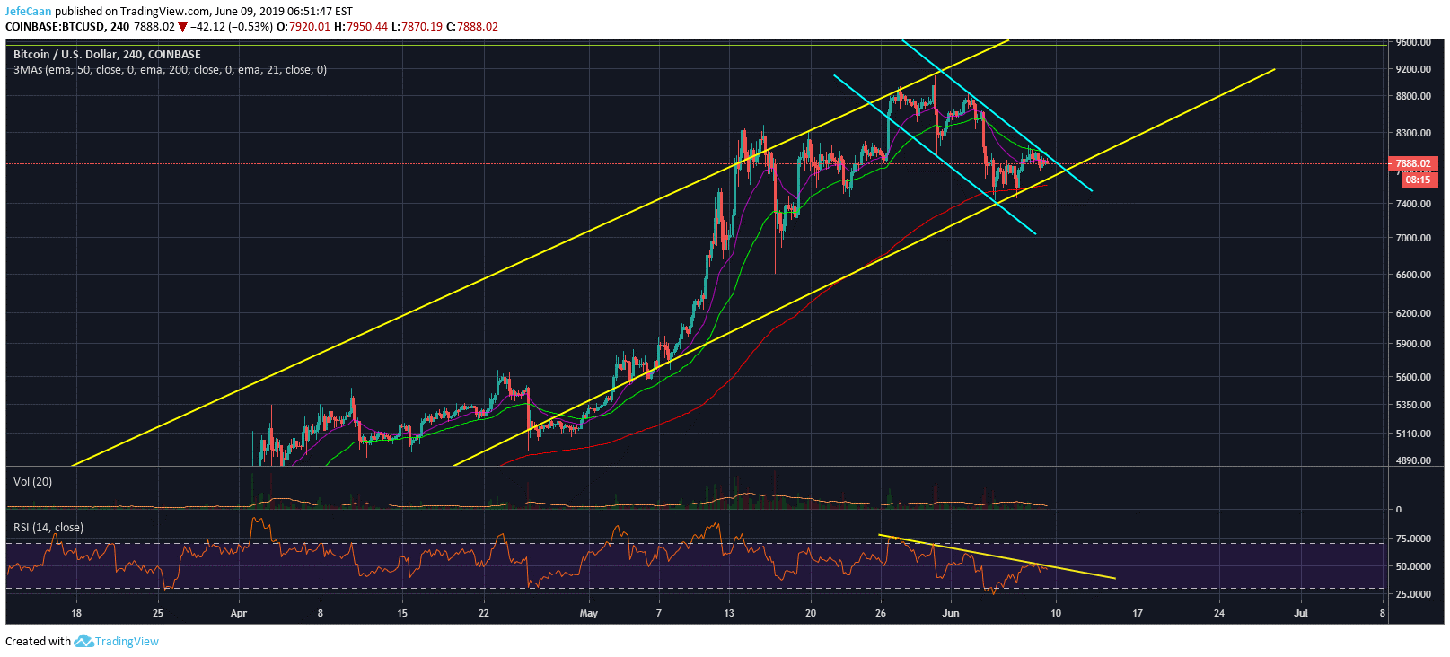
The 4H chart for BTC/USD shows that the price is still trading in an ascending and descending channel at the same time. The downtrend resistance on the RSI indicates that if the price fails to break past this descending channel, we could see the ascending channel being broken short term. We have already seen the price break this channel a few times in the past but the price was quick to get back into the channel.

We could see a similar break below this channel as we did in May, 2019 but that will most likely be a fake out as the price is more likely to rally towards $10,000 from there in the weeks ahead. Bitcoin (BTC) is long overdue for a major correction to the downside but it has to test the 38.2% fib retracement level before it declines further. Even if it ends up declining at this point, it is extremely unlikely to begin a new downtrend towards its true bottom before rallying towards $10,000. The Fear and Greed Index was at 27 two days back. Today, it is hovering around 62. We are very likely to see this index rise towards a new all-time high in the weeks ahead as investors FOMO into the market.