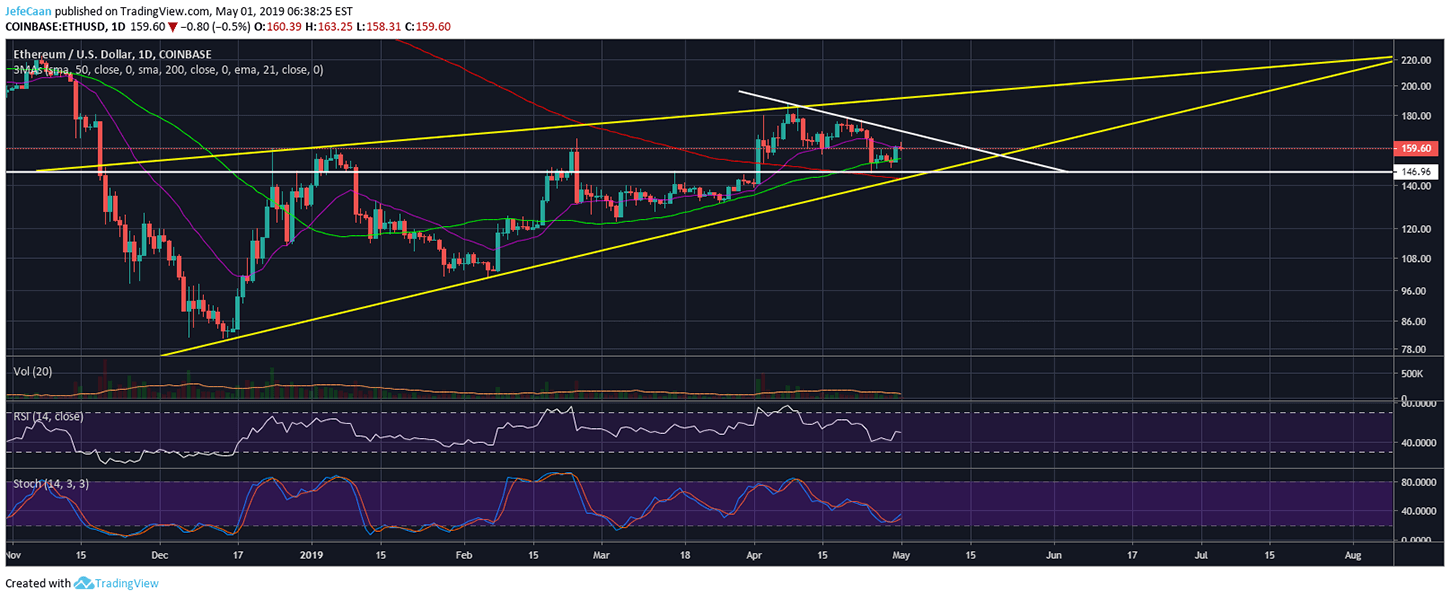
Ethereum (ETH) is reluctant to rally towards its trend line resistance as the price has stopped midway without their being any strong resistance in the way. It is still likely that we might see ETH/USD crawl towards the trend line resistance but the weakness shows that the price will face a strong rejection once it gets there. The RSI and Stochastic indicators on the daily time frame also show that there is plenty of room for a rally but the price action continues to remain very weak. The price is now trading within a descending triangle that is part of a large rising wedge. This has highly increased the odds of a sharp decline in ETH/USD in the near future. The price failed to capitalize on the recently formed golden cross and is now short a major catalyst that could push it up when all the odds are stacked against it.
ETH/USD remains massively overbought on the weekly time frame. In fact, ETH/USD has not been this overbought since the beginning of the bear market. This shows that the price is due for a major pullback. There is still some room for the price to trade within the descending triangle till the end of the month. However, soon it will have to decline below it and the rising wedge at the same time. It will be a sharp move to the downside and ETH/USD could see a fall towards new lows. We expect the price to find its true bottom around $60 as discussed in our previous analyses. Ethereum (ETH) is losing is shine as a lot of new projects have entered the scene. The people who used to say they will sell their houses to buy Ethereum (ETH) around $400 when it was trading at $1,000 are nowhere to be found.
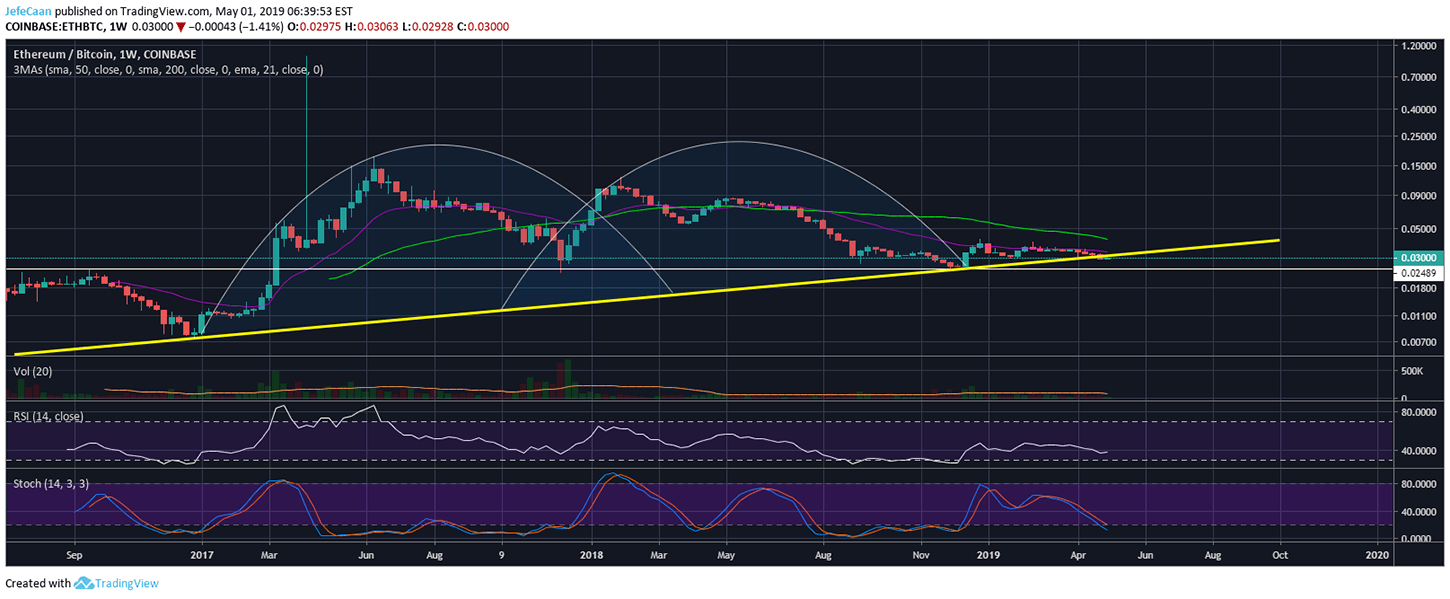
Ethereum (ETH) has also faced sever setbacks against Bitcoin (BTC) in the recent past. The price has now declined massively against Bitcoin (BTC) and the RSI and stochastic indicators are close to oversold territory. That being said, the next big move to the downside might easily push ETH/BTC below its trend line support which it will then have to test as a resistance. There is also a strong horizontal support around the 0.02489 BTC level that will be very hard to breach.
The more the price of an asset tests a particular level, the greater the odds that it will eventually break it. We have seen ETH/BTC test this support two times already. If it tests it for the third time especially when the market is in a strong downtrend, it is very likely to break it. This will be no different than the break of market structure when Bitcoin (BTC) broke below $5,800-$6,000 and started to decline towards $3,000. The ongoing market cycle continues to be shorter than the previous one if we consider the bottom is in. Given that every market cycle in Bitcoin (BTC) history has been longer than the previous one, we expect Ethereum (ETH) to see a steady decline in the weeks and months ahead.