Bitcoin (BTC) started to fall hours before the VanEck/SolidX ETF decision delay but soon after news of the delay broke, the price started to rally. A rejection may not have had the same effect but the response to a delay decision is also not what most expected it to be. The price of Bitcoin (BTC) has rallied aggressively the past few weeks on the assumption that the bear market is over and that new institutional products including ETFs are just around the corner. This narrative would have been really strengthened had this ETF been approved. However, strong price manipulation and shady dealings of some key players in the market left little hope that this ETF would be approved at this time.
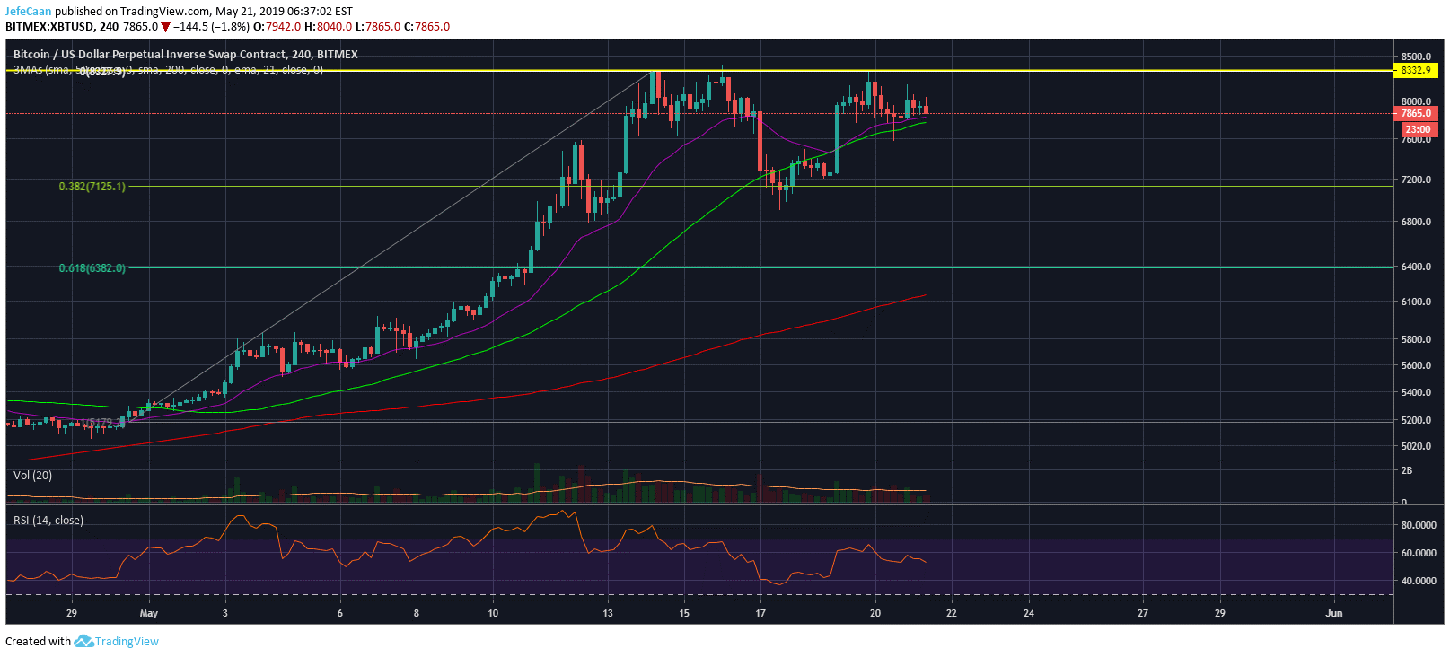
The 4H chart for BTC/USD shows that the price previously flash crashed to the 61.8% Fib extension level but recovered quickly from there. Since then it has formed a double bottom which is an even more bearish development one that could see the price fall again to the 61.8% fib extension level. This decline is even more probable after the ETF decision delay as the market is now short a key catalyst that would have fueled the next rally. Many traders are beginning to realize that this rally has indeed gone too far and it might be time for a correction. The bears are scared to push harder because the last time they did, most of them ended up as cannon fodder as the price shot up through key resistance levels. This time it is likely to be the decision of the whales and we might see the price attempt to form a triple top before starting to decline.
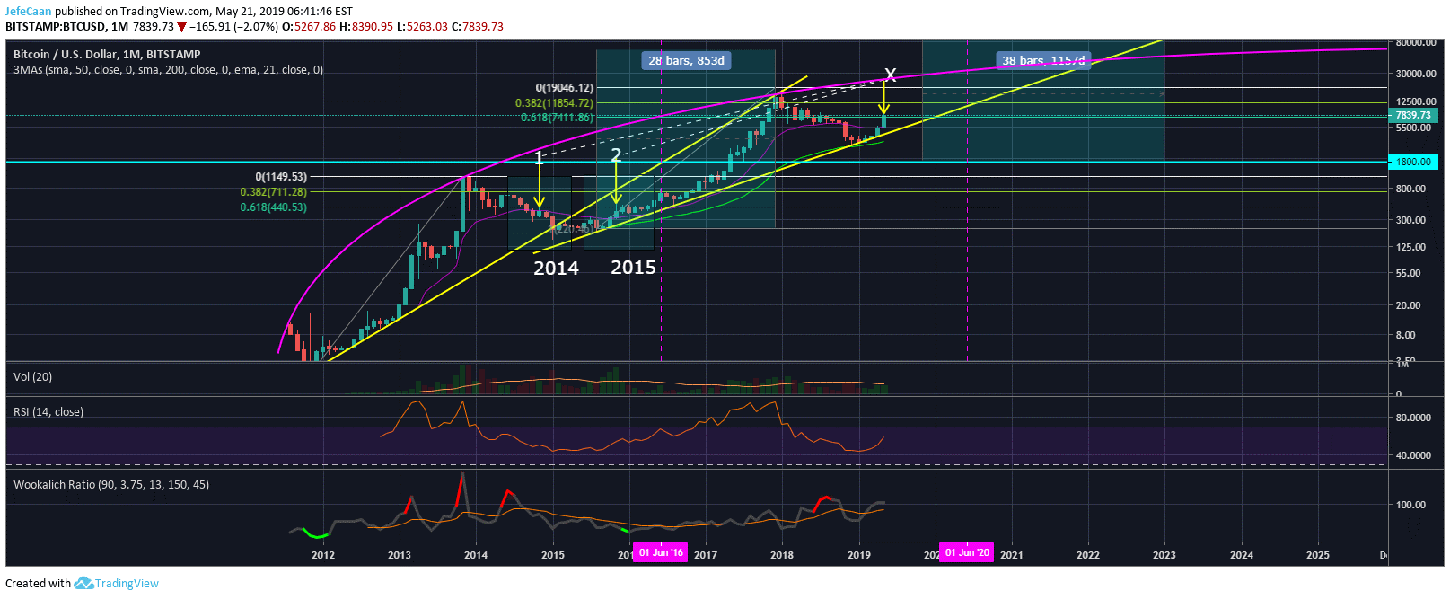
This is an important stage for both the bulls and the bears as the former think the bear market is over and it might be their last chance to accumulate at current prices whereas the latter hold that the price has a lot of room to fall and it might be their last chance to short sell. The monthly chart for BTC/USD shows that Bitcoin (BTC) has come a long way since 2012. However, with every passing market cycle, we are going to see the rate of growth decline. This is because with every market cycle we see more money flowing into the market and bigger institutions getting involved. This also means that succeeding market cycles will be longer than preceding ones.


The curve that runs through the tops on the monthly chart shows that the next market cycle is perhaps going to be the last of the euphoric cycles. In other words, this might be the last chance for Bitcoin (BTC) to see some aggressive growth that will reflect the previous cycles in some ways. The price might end up reaching $50,000 at the peak of the next cycle but it is likely to come down to $1,800 or lower levels before it begins its climb. As mentioned in my previous analyses, the trend line shown on the monthly chart that BTC/USD is currently trading on has to be broken for the price to bottom. This trend line support will then serve as trend line resistance for the next cycle.