Ethereum (ETH) Likely To Retest $188 Resistance Before Next Decisive Move
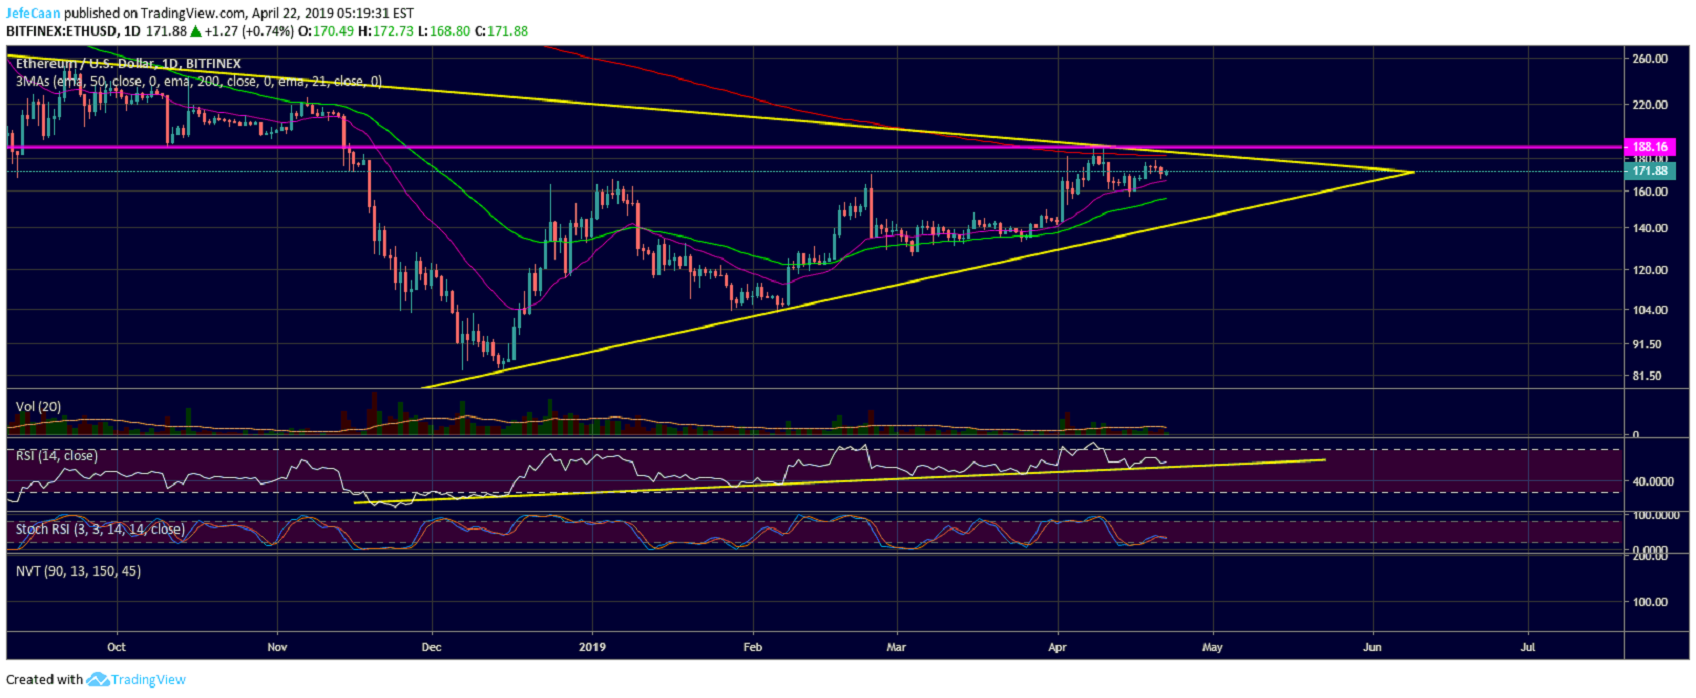
Ethereum (ETH) has started the day in green and as we can see on the daily chart for ETH/USD, the price has been forming higher lows since the beginning of the month. This means that Ethereum (ETH) is now close to a breakout but before that, the price may end up retesting the $188 resistance. This retest will most likely be a sharp wick to the upside as the daily candle is very likely to close below the 200 day EMA that lies below the $188 resistance. RSI for ETH/USD has also found trend line support on the daily time frame and indicates that the price could go higher from here to test the strong resistance at $188 once again. It is pertinent to note that the price faced a strong rejection at this level the last time it tested it. Its next attempt of a retest failed as the price was stopped at the 200 day EMA.
Unlike Bitcoin (BTC), Ethereum (ETH) has already tested the previous market structure as resistance and faced a strong rejection. It is extremely unlikely to break past the $188 resistance. In fact, the bulls are going to have a hard time even pushing past the 200 day EMA. The price is unlikely to close above that level and we might see a sharp pullback from there in the weeks and months that follow. Our price target of $60 for Ethereum (ETH) is still intact which we expect to be hit somewhere around the end of July or mid-August. The actual bottom could be lower than that and the price might end up falling to $50 or lower. That being said, Ethereum (ETH) remains a promising project and it has a high probability of surviving the next crash. However, most ICO projects on Ethereum (ETH) are expected to go belly up during the next few months.
The beauty of a bear market is that it has a cleansing effect. Most of the useless projects or scams are wiped out of the market and only projects that are strong enough to withstand extreme pressures remain and end up becoming diamonds during the next bullish cycle. This is also a good opportunity of investors to see which projects to back during the next cycle. Unfortunately, the majority of investors are left heartbroken after a prolonged period of bloodbath in the markets and they only return during the middle of the next hype cycle.
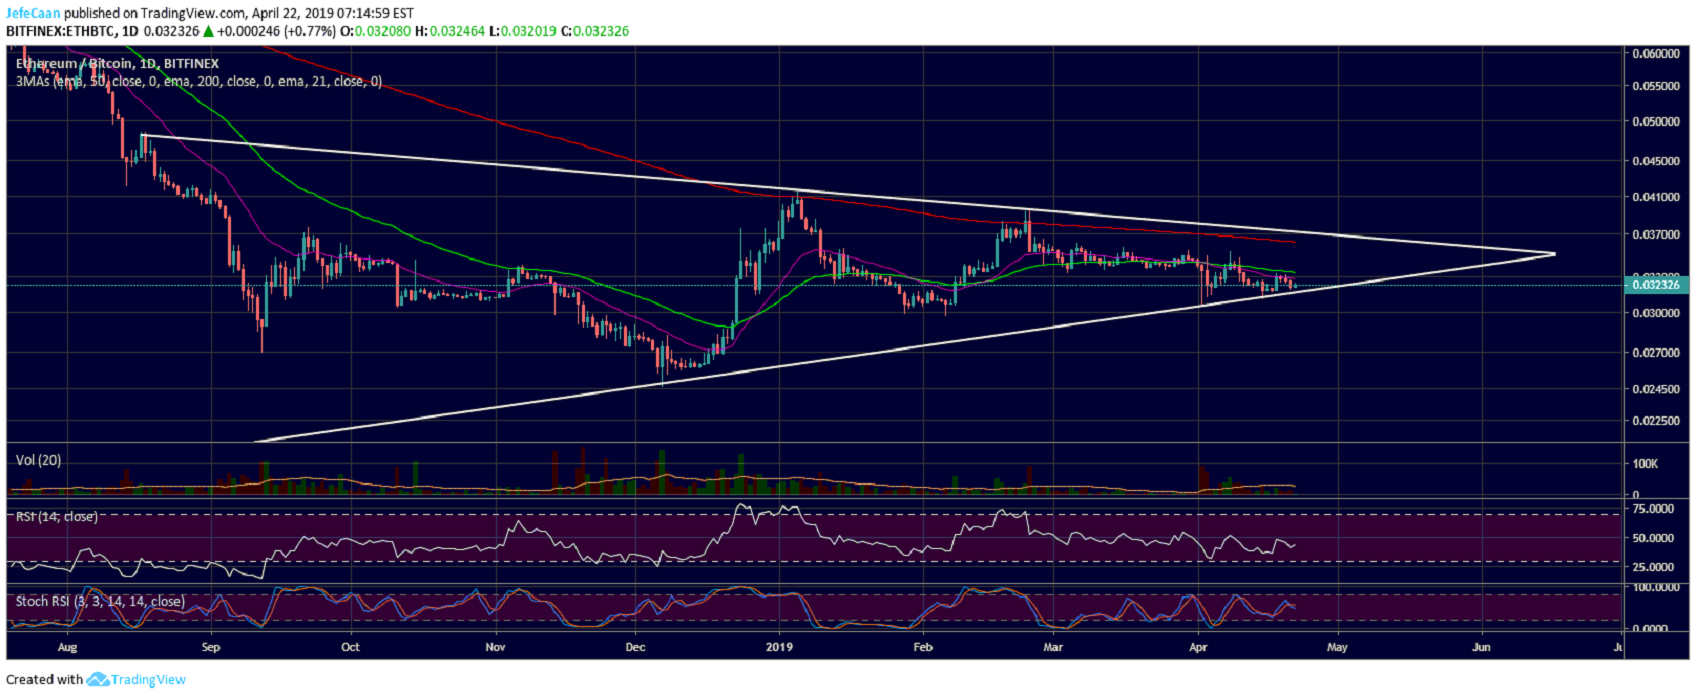
The daily chart for ETH/BTC shows that Ethereum (ETH) has still plenty of room to rally against Bitcoin (BTC). The price could end up rallying towards the 200 day EMA to say the least. Although a break out of the symmetrical triangle seems unlikely at this point, the rally towards the 200 day EMA will get most investors excited once again. Needless to say, the bullish euphoria is now near levels we have only seen around the beginning of the bear market. The Fear and Greed index is at 61 (greed) up from 50 (neutral) last week. The index was at 74 around the beginning of the bear market which shows that investors are too optimistic too early and the market has yet to inflict maximum pain.