Sally Ho's Technical Analysis 21 April 2019
Bitcoin
Bitcoin (BTC/USD) weakened early in the Asian session to test an important level, trading as low as the 5260.64 area, just below the 5265.70 area that represents the 50% retracement of the 7402.50 – 3128.89 area. We have written about the significance of this level extensively, including in our 20 April 2019 analysis.
Traders are curious to see if BTC/USD again challenges the 5349.70 area, representing the 76.4% retracement of the 5488.00 – 4901.99 range. Above this area, the 5403.82 level represents the 61.8% retracement of the move from 6810.00 to 3128.89.
As noted yesterday, technicians are eager to see if BTC/USD can establish a supportive base around the 5265 – 5195 range in an attempt to test some additional technical Resistance.
Price activity is nearest the 50-bar MA (4-hourly) at 5185.32 and the 50-bar MA (Hourly) at 5287.89.
Technical Support is expected around 5040.29/ 4877.05/ 4582.91 with Stops expected below.
Technical Resistance is expected around 5403.82/ 5769.98/ 5941.26 with Stops expected above.
On 4-Hourly chart, SlowK is Bullishly above SlowD while MACD is Bearishly below MACDAverage.
On 60-minute chart, SlowK is Bullishly above SlowD while MACD is Bearishly below MACDAverage.
Ethereum
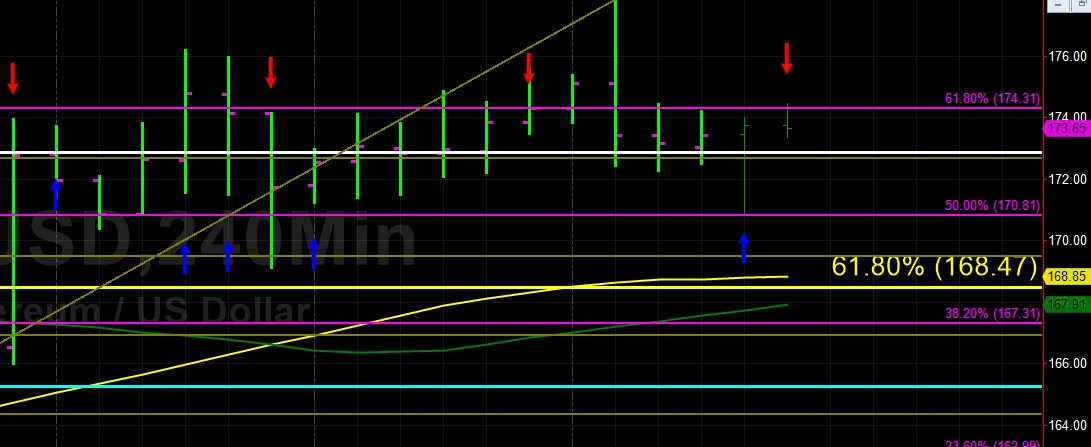
Ethereum (ETH/USD) traded very technically in today’s Asian session, first testing Bids around the 170.87 area, right around the 50% retracement of the move from 185.62 to 156.00. The pair then moved higher and tested Offers around the 175.93 area, just above the 61.8% retracement of the same range. The 177.84 level was yesterday’s daily High and traders are curious if the market has the resolve to punch past that area and test the 178.63 level, representing the 76.4% retracement of the aforementioned range.
Above that area, the 189.23 level is a key technical target, representing the 76.4% retracement of the move from 222.78 to 80.60. Below current price activity, the 169.50 area retains technical significance and then the 100-bar MA (4-hourly) and 50-bar MA (4-hourly) lay in waiting.
Price activity is nearest the 100-bar MA (4-hourly) at 168.85 and the 50-bar MA (Hourly) at 173.27.
Technical Support is expected around the 162.99/ 156.53/ 151.69 levels with Stops expected below.
Technical Resistance is expected around the 179.40/ 185.62/ 214.08 levels with Stops expected above.
On 4-Hourly chart, SlowK is Bullishly above SlowD while MACD is Bullishly above MACDAverage.
On 60-minute chart, SlowK is Bullishly below SlowD while MACD is Bearishly below MACDAverage.
Litecoin
Litecoin (LTC/USD) found a Bid during the Asian session after trading as low as the 79.66 area, eventually reaching the 82.40 level. Minor Stops were elected above the 82.18 area, representing the 61.8% retracement of the move from 83.73 to 79.66. Another minor upside target is the 82.77 level, representing the 76.4% retracement of the same range.
Above this area, the 83.97 level is technically relevant, representing the 76.4% retracement of the move from 103.06 to 22.17. Below the current range, 76.39 represents the 23.6% retracement of the move from 251.90 to 22.17.
Another move higher may see LTC/USD test key technical areas including 84.71/ 86.12/ 87.61, some of which we identified in our 16 April 2019 analysis.
Price activity is nearest the 100-bar MA (4-hourly) at 83.49 and the 50-bar MA (Hourly) at 81.70.
Technical Support is expected around the 72.10/ 67.17/ 62.62 levels with Stops expected below.
Technical Resistance is expected around the 87.39/ 92.56/ 102.26 levels with Stops expected above.
On 4-Hourly chart, SlowK is Bullishly above SlowD while MACD is Bearishly below MACDAverage.
On 60-minute chart, SlowK is Bullishly above SlowD while MACD is Bullishly above MACDAverage.
Bitcoin Cash
BCH/USD (Bitcoin Cash/ US dollar) encountered a little bit of buying pressure early in today’s Asian session, trading as high as the 302.97 area after finding support around the 294.63 area. Today’s intraday low was right around the 50% retracement of the move from 254.17 to 332.64.
Key upside targets include 315.92/ 330.57 and key downside targets include 284.15/ 272.69.
Price activity is nearest the 50-bar MA (4-hourly) at 300.55 and the 50-bar MA (Hourly) at 302.34.
Technical Support is expected around the 277.46/ 265.55/ 254.17 levels with Stops below.
Technical Resistance is expected around the 332.55/ 349.99/ 366.11 levels with Stops above.
On 4-Hourly chart, SlowK is Bearishly below SlowD while MACD is Bearishly below MACDAverage.
On 60-minute chart, SlowK is Bullishly above SlowD while MACD is Bearishly below MACDAverage.
