XMR Drops 16% in Seven Days, Tracking Bitcoin Despite Lighter Hacker's Monero Buys
 Alex Carter

Three Things to Know
- Funds stolen in the Lighter breach were routed through Hyperliquid and used to buy Monero, on-chain tracker Lookonchain said.
- Momentum indicators still favor sellers, and the hacker's buying left no visible mark on the price.
- Resistance near $535 is the first test buyers must pass.
Monero slid harder than Bitcoin this week, even as a hacker bought the coin with stolen money.
The episode revives old questions about privacy coins and illicit flows. It also shows that one motivated buyer cannot lift a coin against broad selling. Traders now want to know whether Monero can steady itself or whether Bitcoin drags it lower.
Stolen Lighter Funds Rotate Into Monero via Hyperliquid
Lookonchain reported that funds stolen in a breach of Lighter were moved to Hyperliquid. Once there, the attacker used them to buy Monero (XMR). Lighter is a decentralized trading platform, and Hyperliquid is a separate onchain exchange with deep liquidity.
The tracker did not disclose how much was taken, how much XMR was bought or when. Traders cannot judge how much demand the buying created.
Monero fits a familiar pattern. It hides sender, receiver and amount by default. Attackers often swap stolen funds into privacy coins to break the public trail that tools like Lookonchain follow.
Critics already link privacy coins to illicit flows, and this case gives them a fresh example. The market shrugged it off. The hacker's purchases produced no visible lift in the price.
Hacker Demand Fails to Stop a Bitcoin-Shaped Slide
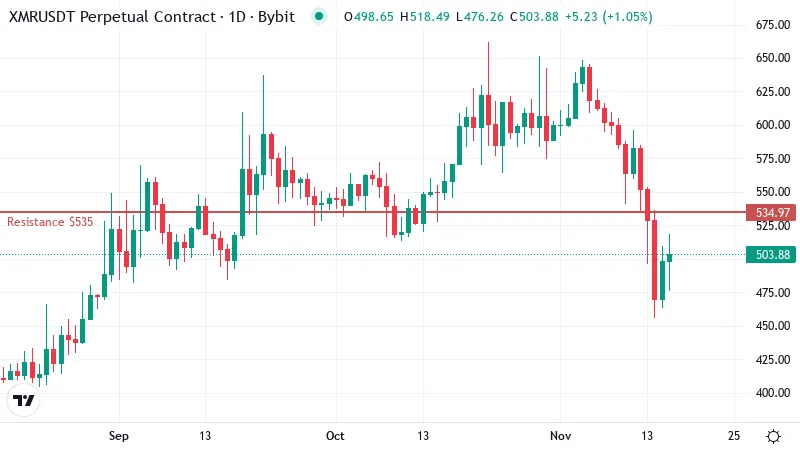
Monero now trades near $505, down about 16% over seven days. Bitcoin lost about 14% over the same stretch. XMR fell harder than the market leader, so whatever the hacker bought did nothing to offset the broad selling.
Anyone reading the news as a bullish signal should note that gap. Monero moved with Bitcoin, only a little worse.
The monthly picture looks calmer. XMR is down about 10% over 30 days, a smaller loss than the weekly drop. Most of the damage landed in the last few sessions, after a period when the coin was holding up better.
Moving averages help put the slide in context. A moving average smooths out daily prices to show the underlying trend. XMR now sits below its 50-day average near $561. That line has turned from a floor into a ceiling, and buyers will need to clear it to repair the trend.
The longer view still holds. Monero remains above its 200-day average, near $474, which reflects the trend over most of a year. The uptrend is damaged, but it has not broken.
Over the past day, XMR gained about 1%. One green session after a sharp drop is common, and it often reflects short sellers taking profits. For now, the bounce looks like a pause until price recovers more of the week's losses.
Sellers Keep the Upper Hand as Momentum Points Lower
RSI, a 0 to 100 gauge of momentum, sits near 37 on the daily chart. That reading is weak, but it is still above the oversold zone below 30. In plain terms, sellers have room to push further before the coin looks stretched enough to invite a reflex bounce.
The MACD, which compares short and longer price trends, remains below its signal line. That means downside momentum has not faded yet. The small gain of the past day did not change that picture.
Trend strength tells the same story. The reading points to a real trend, and sellers are the ones leading it. Strong trends tend to persist until something breaks them, and buyers have shown no sign of taking control.
Why $535 Matters More Than the Distant Floors
The first real test sits overhead. Resistance stands only a short climb from current levels. Sellers have defended that zone during the past week's slide. A daily close above it would mark the first sign that buyers can absorb the selling.
Clearing that level would also open the path toward the 50-day line, a test of whether the recovery can last.
The downside looks very different. The listed supports sit far lower, near $169 and then $145. Those levels are too distant to guide trading this week. The 200-day average is the practical floor to watch first, since it sits much closer to price.
A break below that long-term line would change the picture. The chart shows little structure between it and those deep levels, so sellers would face few obvious places for buyers to step in.
Two Paths for Monero Over the Next Three Days
Bitcoin's direction will likely decide which of these plays out first.
- Bullish: A daily close above the nearby resistance would put the 50-day average in reach as the next target. A slide back below today's price would cancel that setup and hand control back to sellers.
- Bearish: A break under the 200-day average would extend the slide toward far thinner support. A recovery back above that overhead resistance would invalidate the bearish case and point to a short squeeze.
Headlines Aside, Bitcoin Still Sets the Pace
The hacker's purchases look like noise against the broader market. Bitcoin's next move remains the better guide.
One risk sits outside the chart. Regulators already watch privacy coins closely, and exploit laundering cases like this one could invite fresh scrutiny and new delisting pressure.
Disclaimer: This article is provided for informational purposes only. It is not offered or intended to be used as legal, tax, investment, financial, or other advice.
Disclaimer: This article is provided for informational purposes only. It is not offered or intended to be used as legal, tax, investment, financial, or other advice.
Related Stories