LINK Falls to $9 as Chainlink ETFs Log Their First Outflows Since December 2025
 Alex Carter

Three Things to Know
- US spot Chainlink ETFs logged their first weekly net outflow since December 2025, all from a single Grayscale fund.
- LINK trades below both its 50-day and 200-day averages, and momentum still favors sellers.
- Bulls need to defend the $7.83 support, the last mapped floor on the chart.
Chainlink's US spot ETFs ended a long streak of weekly inflows. One redemption from Grayscale's fund flipped the tally negative, while the Chainlink Reserve kept buying tokens.
The timing hurts. LINK was already sliding before the fund selling began, and broader crypto ETFs bled cash the same week. Traders now watch whether fresh inflows return or more redemptions push the token lower.
Grayscale Fund Breaks a Year of Steady Chainlink Inflows
US spot Chainlink ETFs posted net outflows of about $705,600 in the week of Nov 9 to 13. All of it left one fund. Grayscale's Chainlink Trust ETF (GLNK) shed $705,591 on Nov 13, after four straight days of zero net flows. The Bitwise Chainlink ETF (CLNK), the other US product, recorded no outflow.
The week broke a long run. CryptoQuant data shows the funds had logged net inflows every week since December 2025. Chainlink funds held about $189.55 million in net assets as of Nov 6, data from SoSoValue shows. That equals roughly 2.29% of LINK's market value, a small slice of the token's supply.
Chainlink was hardly alone. All tracked crypto ETFs shed about $1.40 billion over the same five days. Spot Polkadot ETFs lost $99,350. Avalanche funds stood as the only altcoin ETFs in the green, with inflows of about $230,000.
Some buying came from inside the project. The Chainlink Reserve added 94,500 LINK during the outflow week, partly offsetting the redemption.
LINK Trades Far Beneath Both Long Averages After a 26% Monthly Slide
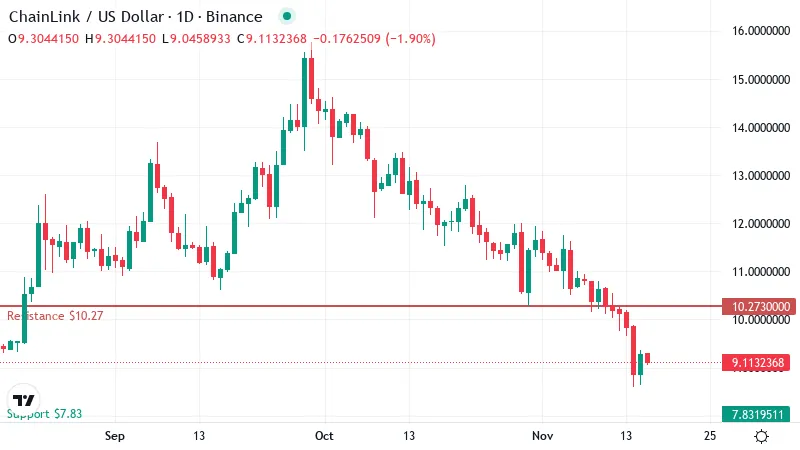
LINK traded near $9.11 at last check, down about 2% over the past day. The token has dropped roughly 12% in a week and about 26% in a month, a steep run for a large-cap coin.
A moving average smooths out daily swings by tracking the mean closing price over a set period. The 50-day average sits near $11.24 and shows the medium-term trend. The 200-day average, around $10.91, tracks the longer picture.
LINK trades below both lines, so both trends point lower. Each average now acts as a ceiling, so any rebound would likely meet sellers as it approaches them.
The order of the two lines also matters. The 50-day still sits above the 200-day, which usually reads as a healthy setup. Here it mostly reflects lag. The slide came fast, and the shorter average has not yet fallen far enough to cross below the longer one. If prices stay this low, that gap should keep narrowing.
On the daily chart, the price hovers near the low end of its monthly range. Buyers have yet to stage any lasting bounce. The Grayscale outflow landed on a chart that was already weak and added pressure to an existing downtrend.
Sellers Keep the Upper Hand Even as RSI Nears Oversold
RSI, a 0 to 100 gauge of momentum, reads about 32 on the daily chart. That is weak, but it has not crossed into oversold territory below 30. Traders often wait for that line before treating a selloff as stretched.
Other momentum signals lean the same way. The MACD, which compares short and long price trends, remains below its signal line. In plain terms, downward momentum has not faded. Trend-strength readings confirm sellers are driving the move.
That combination leaves buyers without a clear entry signal. No indicator shows the decline slowing yet, though readings near oversold often attract short-term buyers.
Where the Floor Sits if $9 Gives Way
The nearest mapped support sits near $7.83, well below the current price. That leaves a wide gap with little in between. If LINK slips under $9, the chart shows few obvious spots where buyers have stepped in before. Selling could then speed up toward that lower level.
No support is mapped beneath that level, so a break would leave traders without a clear reference point. Bulls most need to defend it.
Upside markers are clearer. The first resistance stands near $10.27. A daily close above it would be the first sign of repair after the monthly slide.
The next hurdle is the 200-day line just above. A move through it would put LINK back above its long-term average. That would weaken the case that sellers still own the trend.
Two Paths for LINK Into Next Week
Next week's flow data should help decide which way LINK breaks.
- Bullish: Fresh ETF inflows could lift buyers back into the market. A daily close above first resistance would open a path toward the 200-day average. This view fails if LINK drops back under the round-number level it now clings to.
- Bearish: More redemptions from GLNK could drag the price toward the mapped support far below. A reclaim of first resistance would cancel this path and point to sellers losing their grip.
Downtrend Intact Until Buyers Reclaim Resistance
The first weekly outflow in nearly a year confirms a trend sellers already controlled. It does not mark a bottom. Until LINK closes above first resistance, the downtrend stays in place.
Thin fund assets add risk. One fund's next move could swing sentiment sharply either way.
Disclaimer: This article is provided for informational purposes only. It is not offered or intended to be used as legal, tax, investment, financial, or other advice.
Disclaimer: This article is provided for informational purposes only. It is not offered or intended to be used as legal, tax, investment, financial, or other advice.
Related Stories