NEAR Protocol Price Pullback Forecasts 46% Crash as Crypto Market Flips Bearish
 Alex Carter

Three Things to Know
- NEAR led altcoin losses for a second straight day while Bitcoin clawed back toward a key round number.
- Momentum indicators still favor sellers, and the token now trades under its 50-day average.
- A thin chart below leaves the summer rally floor near $2.73 as the level bulls must defend.
NEAR Protocol extended its slide on Sunday while Bitcoin rebounded and most altcoins stayed red.
That split matters for NEAR now. Holders still sit on big gains from the summer rally, which gives them a reason to sell. Traders want to know whether this is a routine pullback or the start of a much deeper unwind.
NEAR Leads Altcoin Losses While Bitcoin Fights for $78K
NEAR Protocol fell about 6% on Nov 2, the steepest drop among large- and mid-cap tokens. The coin traded near $4.12 that day. The slide followed a roughly 4% loss on Nov 1, so sellers have now pressed the token two sessions in a row.
Bitcoin moved the other way. It climbed more than $2,000 from a multi-week low set on Friday, after the Binance hack rattled traders. The largest cryptocurrency then traded near $77,910 as buyers tried to reclaim $78,000.
The rest of the market showed no clear direction. Ether edged up less than 1% to approach $2,300, and Tron gained 1.7%. Most other altcoins sat in the red, and total crypto market value hovered around $2.69 trillion.
NEAR's recent losses come after a strong stretch. The token remains up about 120% in 90 days, so this drop still looks like a pullback after a big rally.
NEAR Slips Under Its 50-Day Average but Keeps the Long Uptrend
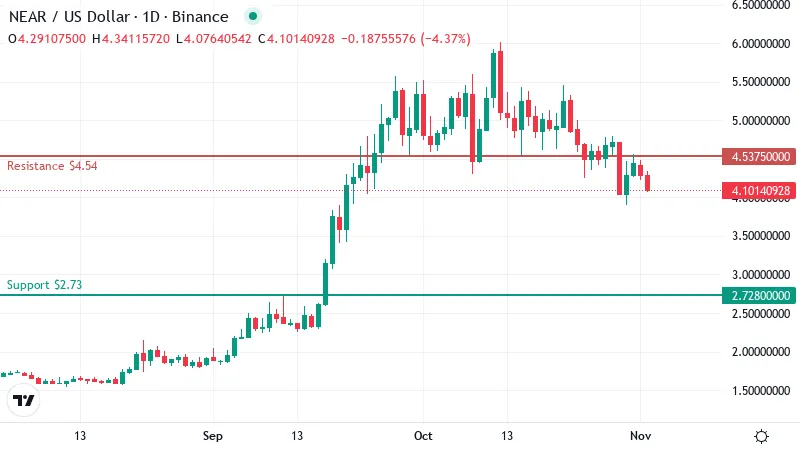
NEAR changed hands near $4.10 at last check, below a level traders watch closely. The 50-day moving average, which tracks the average close of the last 50 sessions, sits around $4.31. A coin trading under this line often finds that sellers step in each time price rallies back toward it.
That makes the 50-day average a ceiling for now. Buyers would need to push NEAR back above it to show the short-term damage has been repaired.
The longer picture still looks healthier. The 200-day average, a slower gauge of the broad trend, stands much lower at about $2.94. NEAR remains well above it, so the uptrend that began with the summer rally has not broken.
That wide gap shows how far the token climbed. It also leaves plenty of room for a deeper pullback before the broad trend is tested.
Losses have also spread beyond a single bad day. NEAR has lost about 11% this week and roughly 12% this month. Those figures point to a pullback that has been building for weeks.
Sellers Still Hold the Momentum Edge
RSI, a 0 to 100 gauge of momentum, sits near 42 on the daily chart. That reading leans weak. It also stays well clear of the oversold zone below 30, where selling often starts to exhaust itself. In plain terms, NEAR has room to fall further before bargain hunters usually take notice.
Other momentum signals point the same way. The MACD, which compares short and longer price trends, remains below its signal line. That tells traders downside momentum is still building.
Trend strength readings add to the picture. A new trend appears to be forming, and sellers are the ones leading it.
Together, the signals show no sign that the selling has peaked.
Why $2.73 Is the Floor That Matters Most
The nearest floor on the daily chart sits far below the current price. Between here and there, the chart shows almost no level where buyers have defended NEAR before. That empty stretch is the air pocket behind the deep crash forecast. A slide could travel a long way before it meets real demand.
That area matters because it is the first test of the summer rally. It also sits just under the 200-day average, so a break would hit two signals at once. Buyers would likely treat it as a last line of defense.
If that floor gives way, the next support waits near $2.21. That level is about 46% below where NEAR trades now.
Bulls have a clear task on the upside. A close back above resistance near $4.54 would cancel the bearish read. Beyond that, a push toward $5.52 would mark a return to the trend highs.
Two Paths for NEAR Over the Next Three Days
Traders have two setups to watch.
- Bullish: Buyers reclaim the 50-day average and secure a daily close above first resistance. That move would open a run toward the next ceiling at the trend highs. The setup fails if NEAR slips back below its current price.
- Bearish: NEAR stays capped under the 50-day line, and the slide continues toward the summer floor. A break there would expose the deeper support further down. A daily close above first resistance would cancel this view.
Bears Have the Edge Until NEAR Proves Otherwise
NEAR's short-term bias stays bearish as long as the token trades under its 50-day average. Sellers control momentum, and the chart offers little support until the summer floor.
Bitcoin remains the main risk to that view. A clean break above that round number could pull altcoins higher fast. Traders who shorted late would then face a painful squeeze.
Disclaimer: This article is provided for informational purposes only. It is not offered or intended to be used as legal, tax, investment, financial, or other advice.
Disclaimer: This article is provided for informational purposes only. It is not offered or intended to be used as legal, tax, investment, financial, or other advice.
Related Stories