Shiba Inu Price Prediction: 2 Levels Decide the Meme Coin's Path After a Rare Bearish Cross
 Alex Carter

Three Things to Know
- Shiba Inu just logged its first death cross in 14 months on the daily chart.
- Momentum gauges sit deep in oversold territory, yet sellers still set the pace.
- A nearby floor just under the current price now decides whether buyers get a chance to fight back.
Shiba Inu has confirmed a bearish moving-average crossover, its first since last year. The signal landed after a four-day losing streak and a wave of forced selling across crypto.
Stablecoin balances are shrinking, which leaves less fresh cash for speculative tokens like SHIB. Traders now want to know whether the stretched selling sparks a relief bounce or a break of the last mapped support.
SHIB Prints Its First Death Cross Since September 2025
SHIB flashed a death cross this weekend. The 50-day moving average slipped below the 200-day average, a pattern traders read as a sign of a longer downtrend. It is the first such signal since September 2025.
The cross followed a steady slide. SHIB fell for four straight days starting November 11 and touched a low of $0.0000037 on November 14. That run of losses dragged the shorter average down fast enough to cut through the longer one.
Market conditions offered little help. Liquidations across crypto reached $1.96 billion in 24 hours, according to CoinGlass data. Stablecoin supply also shrank by $17 billion over the past month, the steepest drop since 2022. Glassnode analysts said that decline drains buying power from the market.
Bitwise CEO Matt Hougan sees value ahead but no clear timing. "There will be a big buying opportunity at some point, but it's hard to say when," he said.
Both Moving Averages Now Sit Overhead as SHIB Slides
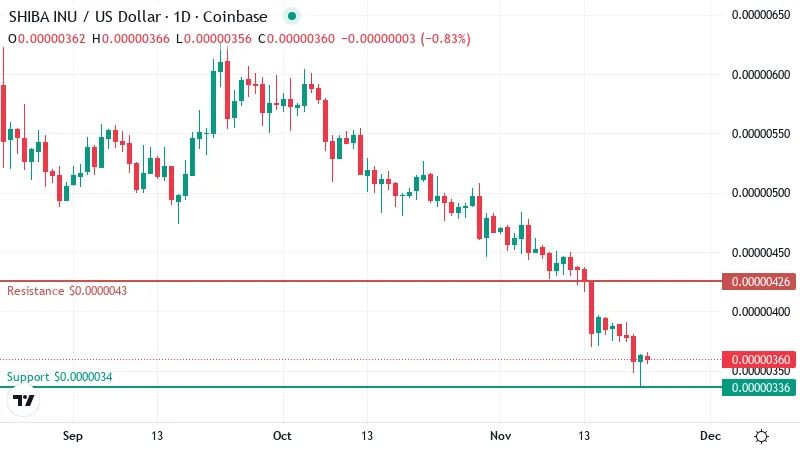
SHIB now trades near $0.0000036, below the low it set during that four-day slide. The coin sits under both of its key moving averages. The 50-day average stands around $0.0000045. The 200-day average is higher still, near $0.0000053.
Those two lines now act as ceilings. A moving average tracks the average closing price over a set number of days, so it smooths out daily noise. When price stays below both, buyers have to clear two layers of recent selling before the trend can turn.
The decline has built over weeks. SHIB lost about 27% over the past 30 days and roughly 6% over the past week. That pattern points to steady pressure from sellers. A single bad headline would usually show up as one sharp drop followed by a quick recovery, and that has not happened here.
Selling paused over the past day. SHIB finished the session flat, with no fresh losses and no meaningful gain either. That suggests sellers eased off for now. It does not show buyers stepping in with any force.
Traders will want higher closes before reading this pause as a recovery.
Oversold Readings Have Not Yet Turned Sellers Around
RSI, a 0 to 100 gauge of momentum, sits near 26. Any reading below 30 counts as oversold. It means sellers have pushed the price down faster than usual, and that kind of stretch often comes before a short relief bounce.
An oversold reading alone does not signal a buy. Momentum still points down, with the MACD line holding below its signal line. That tells traders the selling pace has not started to fade in any measurable way.
Trend strength adds to the caution. The trend gauge shows an established move led by sellers. In strong downtrends, RSI can stay pinned in oversold territory for days or even weeks.
A turn in momentum would be the first sign that buyers are taking back ground.
Where the Floor and Ceiling Sit for the Meme Coin
The nearest floor sits near $0.0000034, just below where SHIB trades now. That level is the first test for buyers. A clean break would leave no mapped support underneath, which means the next stop is hard to judge.
Analysts have flagged $0.000003 as the likely target if the slide continues. That figure is a rough reference and has not been tested as support.
Overhead, the first ceiling stands near $0.0000043. Buyers need a close above it to show the bounce has real backing. That would be the first higher high since the selling began.
Clearing that hurdle opens a path toward the next resistance around $0.0000048. That zone sits close to the 50-day line, so sellers could defend it. A move through both would challenge the bearish read behind the cross.
Relief Bounce or Another Leg Lower
Two daily closes will settle which way SHIB breaks from here.
- Bullish: An oversold bounce that closes above the first ceiling would give buyers their opening. That move would set up a run at the next resistance near the 50-day line. A close back under the nearest floor would cancel this view.
- Bearish: A daily close below that floor would leave SHIB with no mapped support. Sellers could then press toward the analysts' downside target. A move back above the first ceiling would undo this case.
Sellers Keep Control Until the Ceiling Breaks
Sellers hold the upper hand. SHIB stays in a bearish trend as long as it trades under that first ceiling. The oversold reading leaves room for a short bounce, but a bounce alone will not reverse the slide.
Thin liquidity adds risk. With stablecoin supply shrinking, fewer buyers and sellers sit on the order books, so moves in either direction can turn sharp quickly.
Disclaimer: This article is provided for informational purposes only. It is not offered or intended to be used as legal, tax, investment, financial, or other advice.
Disclaimer: This article is provided for informational purposes only. It is not offered or intended to be used as legal, tax, investment, financial, or other advice.
Related Stories