Bitcoin Price Analysis: Gains Partially Retained – 31 August 2023
Bitcoin Price Analysis: Gains Partially Retained – 31 August 2023
Bitcoin (BTC/USD) continued to retain some of its gains early in the Asian session as the pair sought to remain above the 26709.83 level, representing the 50% retracement of the appreciating range from 25234.76 to 28184.89. During the pair’s rapid ascent above the 28000 figure, Stops were elected above key technical levels during the huge rally including the 27139, 27466, 27728, and 27766 areas. Related upside technical levels that BTC/USD could test in the short-term include the 28316, 28548, 29145, 29330, and 30183 areas. Above the market, upside price objectives include the 30526, 30611, 30762, and 31145 areas. Upside price objectives related to other levels of buying pressure include the 32125 and 33569 areas, and Stops are cited above additional upside price objectives around the 32043, 34531, 34658, and 35912 areas. Following the upside run, areas of technical support and potential buying pressure include the 26947, 26620, 26293, and 25828 levels.
Stops were elected below the 27314 and 27234 levels during the pullback after the print around the 28184 area, downside price objectives associated with selling pressure around the 27941 and 27778 areas. Related short-term downside price objectives include the 27045, 27009, 26732, and 26283 levels. Areas of technical support and potential buying pressure in appreciating ranges from the 15460 and 19568.52 levels include the 23661, 22793, and 21725 levels. The recent fresh multi-month low around the 25234.76 area represented a test of a major downside price objective around the 25128.94 area that is associated with selling pressure that increased around the 31862.21 and 30421.29 levels in July. Traders are observing that the 50-bar MA (4-hourly) is bearishly indicating below the 100-bar MA (4-hourly) and below the 200-bar MA (4-hourly). Also, the 50-bar MA (hourly) is bullishly indicating above the 100-bar MA (hourly) and above the 200-bar MA (hourly).
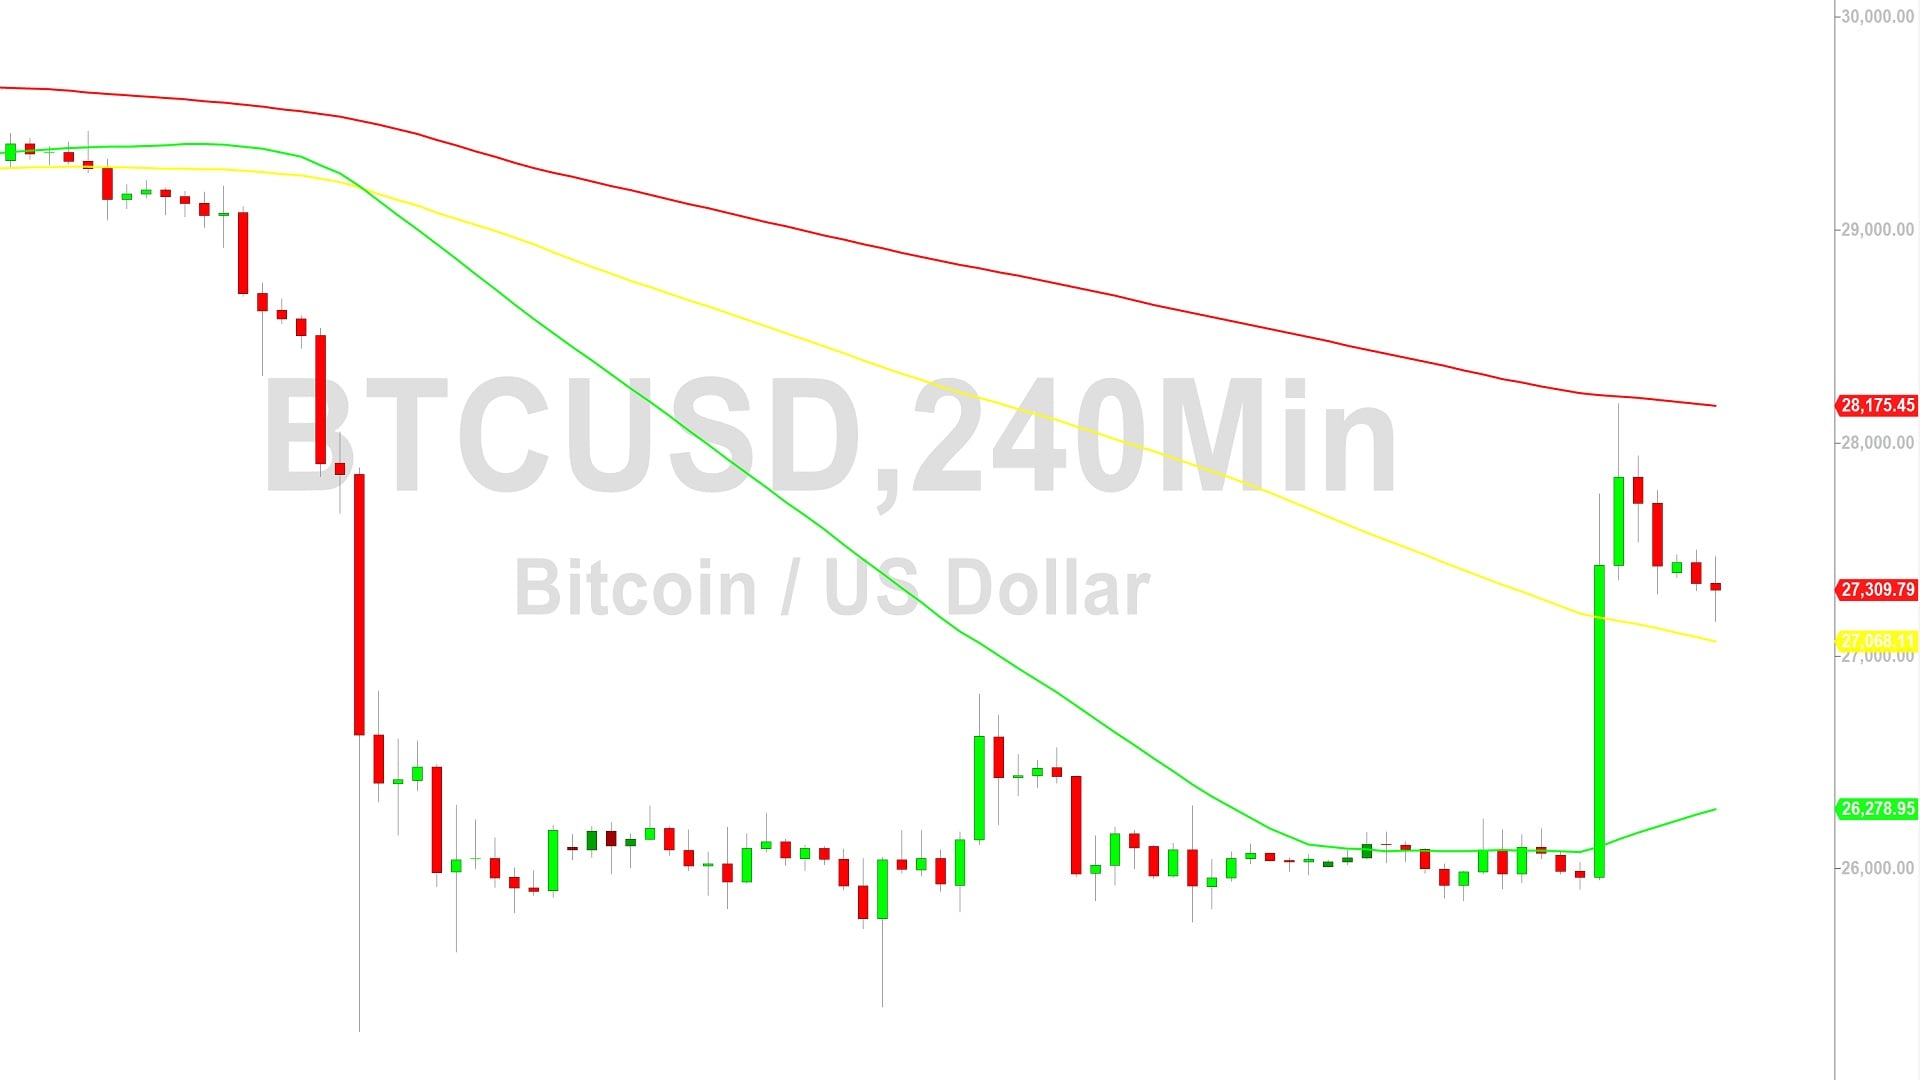
Price activity is nearest the 100-bar MA (4-hourly) at 27068.11 and the 50-bar MA (Hourly) at 26770.83.
Technical Support is expected around 24440.41/ 23270.10/ 22769.39 with Stops expected below.
Technical Resistance is expected around 31986.16/ 32989.19/ 34658.69 with Stops expected above.
On 4-Hourly chart, SlowK is Bearishly below SlowD while MACD is Bullishly above MACDAverage.
On 60-minute chart, SlowK is Bearishly below SlowD while MACD is Bearishly below MACDAverage.
Sally Ho’s Technical Analysis
View Yesterday’s Trading Analysis

Related Stories