Bitcoin Price Analysis: Bearish Reversal at 26187 - 29 August 2023
Bitcoin Price Analysis: Bearish Reversal at 26187 – 29 August 2023
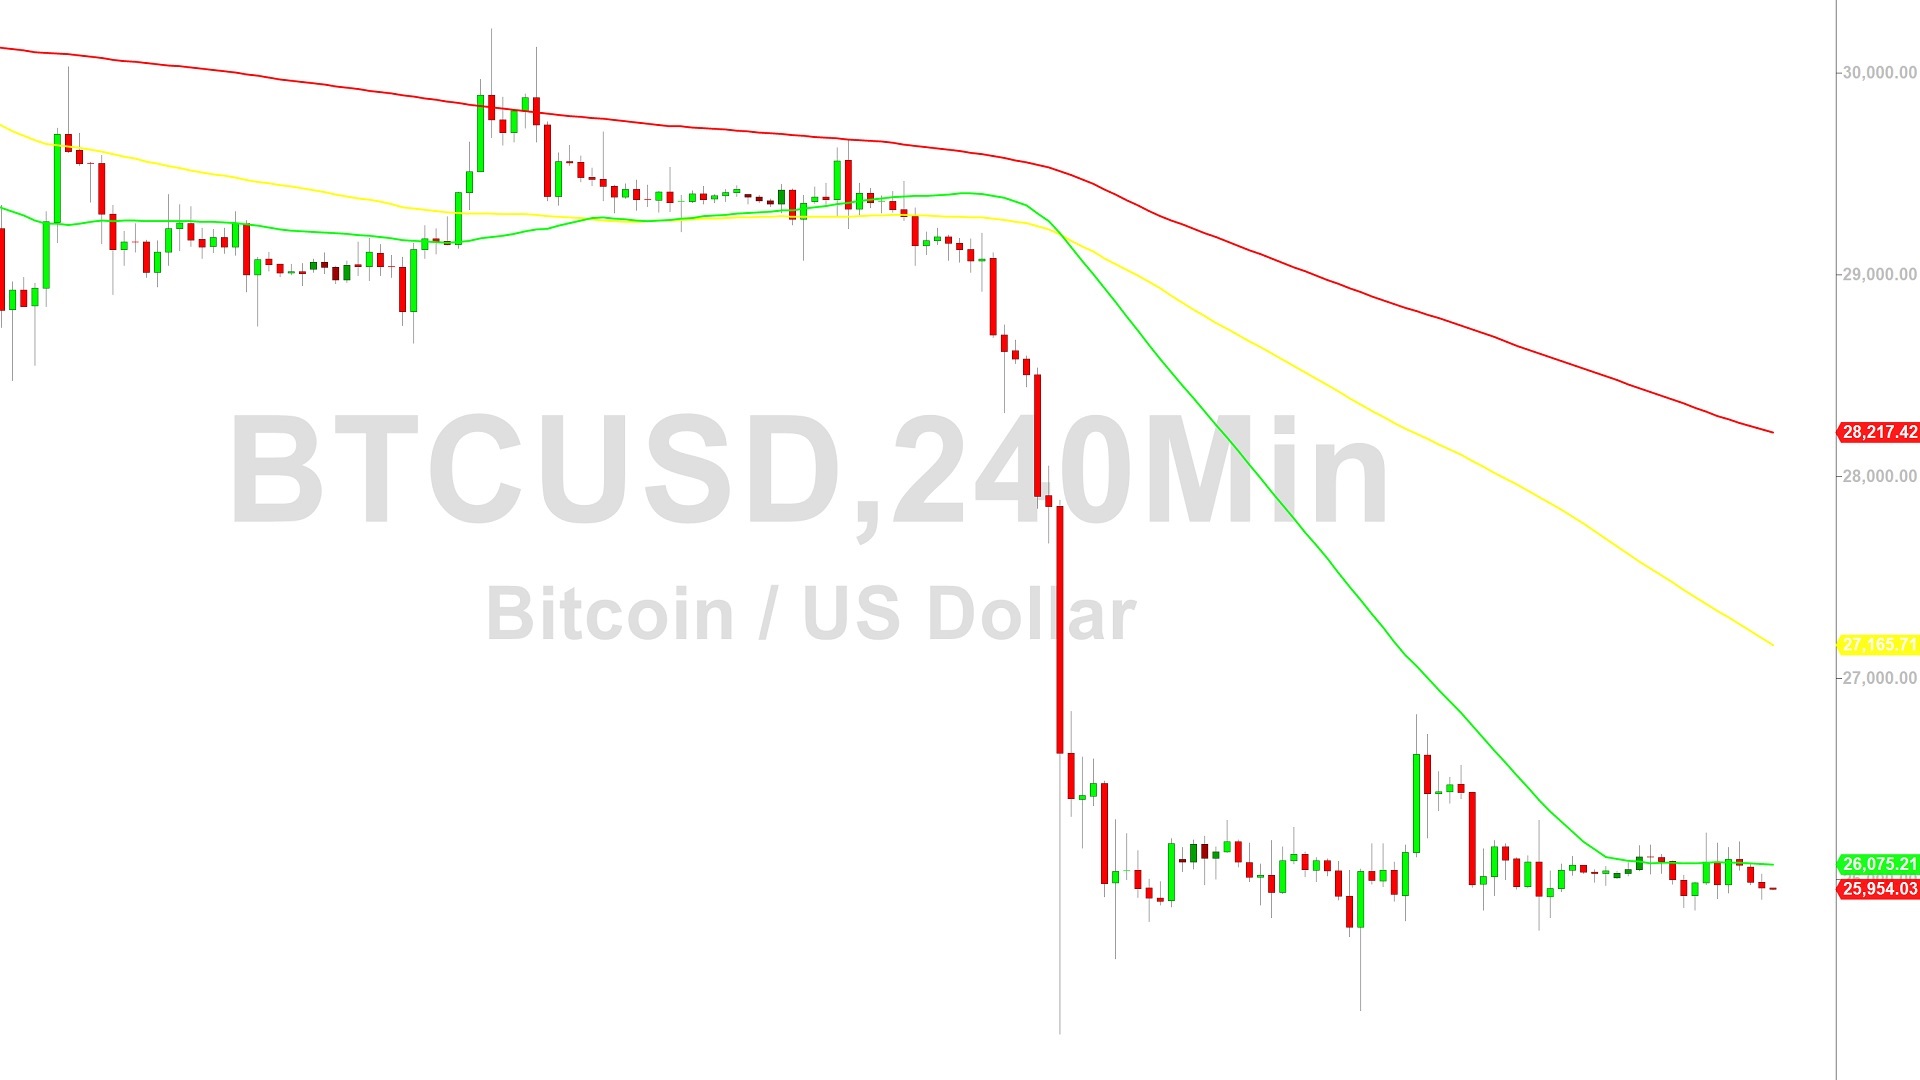
Bitcoin (BTC/USD) retained a negative bias early in the North American session as the pair ran out of upward momentum around the 26187.70 area and came off to the 25903.18 level, representing a test of a downside price objective associated with selling pressure around the 26567.38 area. Technical trading was also recently evident when upside progress reversed around the 26232.88 area, right around a downside price objective linked to recent downward pressure around the 26787.41 and 26567.38 levels. Stops are cited below the 25706, 25698, 25645, 25493, and 25363 levels, downside price objectives related to selling pressure around the 26818 and 26567 areas. Areas of technical support and potential buying pressure in appreciating ranges from the 15460 and 19568.52 levels include the 23661, 22793, and 21725 levels. Following recent selling pressure, areas of technical resistance and potential selling pressure include the 27139, 27728, 27766, 28316, 28548, 29154, 29330, and 30443 levels.
The recent fresh multi-month low around the 25234.76 area represented a test of a major downside price objective around the 25128.94 area that is associated with selling pressure that increased around the 31862.21 and 30421.29 levels in July. Above the market, upside price objectives include the 30526, 30611, 30762, and 31145 areas. Upside price objectives related to other levels of buying pressure include the 32125 and 33569 areas, and Stops are cited above additional upside price objectives around the 32043, 34531, 34658, and 35912 areas. Traders are observing that the 50-bar MA (4-hourly) is bearishly indicating below the 100-bar MA (4-hourly) and below the 200-bar MA (4-hourly). Also, the 50-bar MA (hourly) is bearishly indicating below the 200-bar MA (hourly) and above the 100-bar MA (hourly).
Price activity is nearest the 50-bar MA (4-hourly) at 26078.91 and the 100-bar MA (Hourly) at 26040.47.
Technical Support is expected around 24440.41/ 23270.10/ 22769.39 with Stops expected below.
Technical Resistance is expected around 31986.16/ 32989.19/ 34658.69 with Stops expected above.
On 4-Hourly chart, SlowK is Bearishly below SlowD while MACD is Bullishly above MACDAverage.
On 60-minute chart, SlowK is Bullishly above SlowD while MACD is Bearishly below MACDAverage.
Sally Ho’s Technical Analysis
View Yesterday’s Trading Analysis
Disclaimer: Sally Ho’s Technical Analysis is provided by a third party, and for informational purposes only. It does not reflect the views of Crypto Daily, nor is it intended to be used as legal, tax, investment, or financial advice.

Related Stories