Bitcoin Price Analysis: 28544 Technicals Tested - 11 April 2023
BTC/USD Lifted from 27828: Sally Ho’s Technical Analysis – 11 April 2023
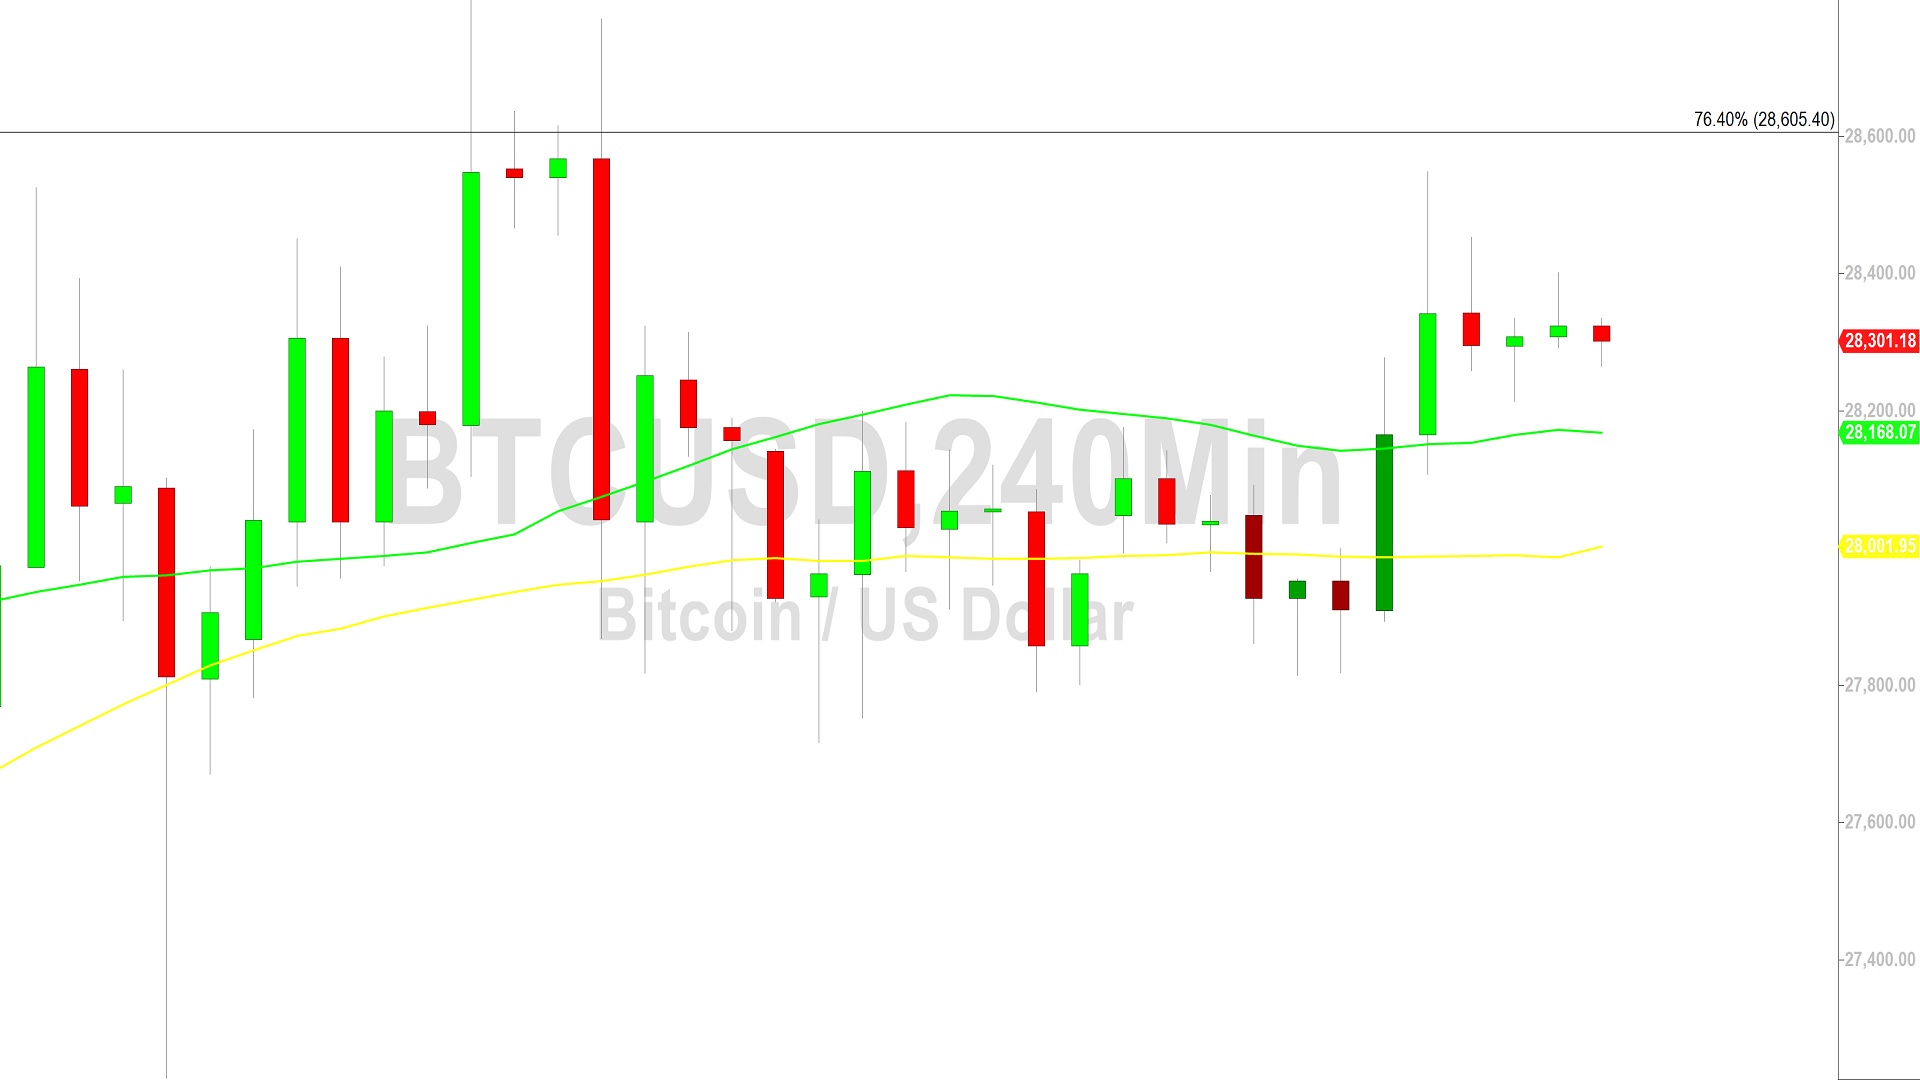
Bitcoin (BTC/USD) worked to retain recent gains early in the Asian session as the pair orbited the 28323.86 level after trading as high as the 28547.67 area, representing a test of the 78.6% retracement of the recent depreciating range from 28770.47 to 27716.77. Traders previously lifted BTC/USD from the 27814 area during a short-term appreciation, representing a test of the 61.8% retracement of the recent appreciating range from 27227.61 to 28799.99. Traders previously knocked BTC/USD as low as the 27716.77 area, representing a test of a downside price objective around the 27726.99 level that became technically significant following selling pressure around the 28770.47 and 28323.86 levels. Related downside price objectives include the 27480, 27176, and 26683 levels, and additional price objectives related to selling pressure around the 28111.54 area include the 27594, 27230, 26867, 26418, and 25691 levels. Above current price activity, bulls continue to eye the 30127.80 area, an upside price objective associated with buying pressure around the 15460 and 19568.52 levels.
Following the most recent appreciation, upside price objectives include the 29244.66, 29639.37, 30127.80, 30275.12, 30763.09, and 31477.37 levels. Following the ongoing appreciation, retracement levels and areas of potential technical support include the 25948, 25756, 25358, 24253, 24099, 23789, 23147, 22605, and 22198 levels. Below current price activity, downside price objectives include the 19266, 19132, 19106, 19006, 18981, 18919, 18822, 18116, 17720, 17523, 17457, 17230, and 17196 areas. Traders are observing that the 50-bar MA (4-hourly) is bullishly indicating above the 100-bar MA (4-hourly) and above the 200-bar MA (4-hourly). Also, the 50-bar MA (hourly) is bearishly indicating below the 100-bar MA (hourly) and below the 200-bar MA (hourly).
Price activity is nearest the 50-bar MA (4-hourly) at 28167.63 and the 200-bar MA (Hourly) at 28170.93.
Technical Support is expected around 25256.83/ 24224.60/ 21753.70 with Stops expected below.
Technical Resistance is expected around 29244.66/ 29639.37/ 30127.80 with Stops expected above.
On 4-Hourly chart, SlowK is Bearishly below SlowD while MACD is Bullishly above MACDAverage.
On 60-minute chart, SlowK is Bearishly below SlowD while MACD is Bearishly below MACDAverage.
Disclaimer: Sally Ho’s Technical Analysis is provided by a third party, and for informational purposes only. It does not reflect the views of Crypto Daily, nor is it intended to be used as legal, tax, investment, or financial advice.

Related Stories