Bitcoin Price Analysis: Orbiting 25000 - 17 March 2023

BTC/USD Orbiting 25000 Level: Sally Ho’s Technical Analysis – 17 March 2023
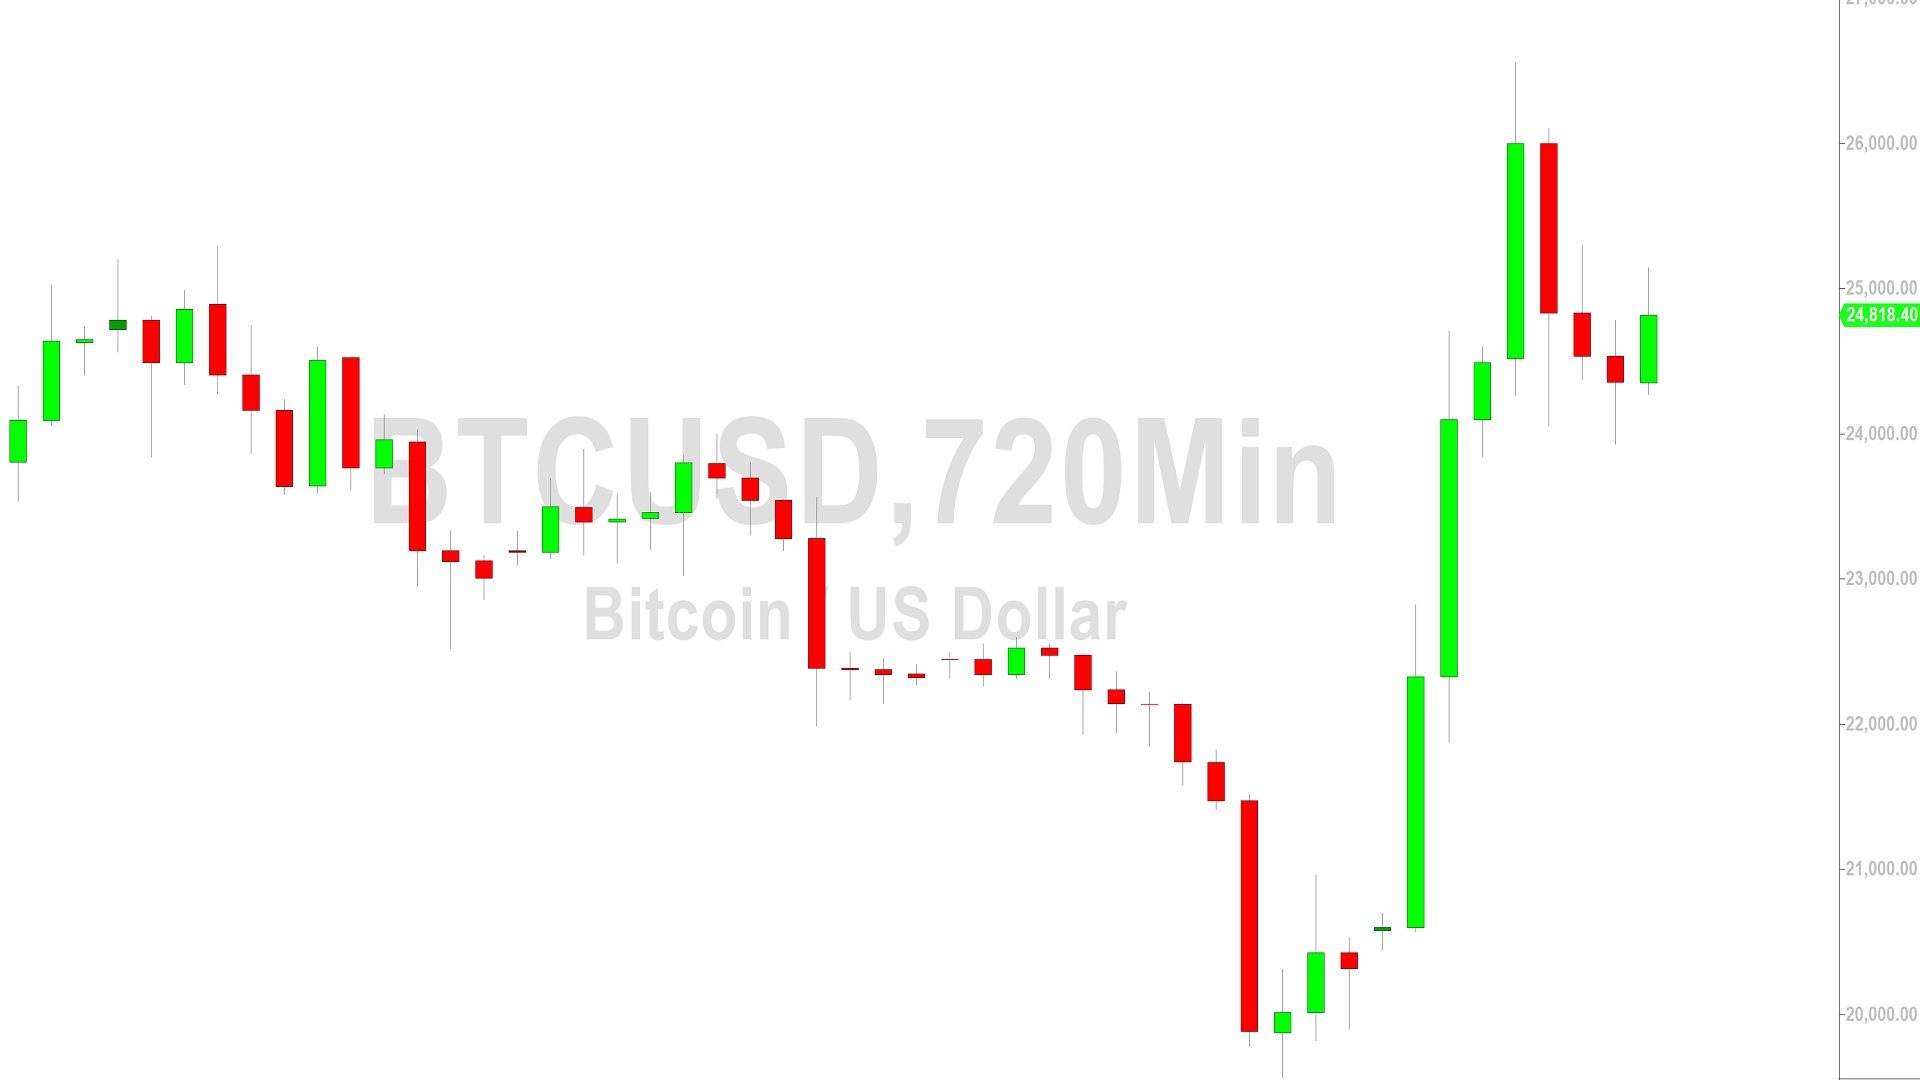
Bitcoin (BTC/USD) continued to orbit the 25000 figure early in the Asian session as the pair awaited fresh technical guidance following some recent buying activity around the 24207.54 area, representing a test of the 61.8% retracement of the depreciating range from 25288.88 to 19568.52. Recent selling pressure around the 25300 area represented a test of the 50% retracement of the recent depreciating range from 26553.90 to 23931.01. Buying pressure emerged around the 24064.72 area during a recent pullback, a level that represents the 78.6% retracement of the depreciating range from 25288.88 to 19568.52. Stops were recently elected above the 25288.88 area, February’s multi-month high, after Stops were triggered above the 21753, 22428, 23103, 23938, and 24064 levels. Upside price objectives related to buying pressure around the 15460 and 16326.16 areas include the 26931, 27609, 28004, 29244, and 29639 levels.
Following the ongoing appreciation, retracement levels and areas of potential technical support include the 23885, 23667, 23061, 22985, 22882, 22236, and 21882 levels. Below current price activity, downside price objectives include the 19266, 19132, 19106, 19006, 18981, 18919, 18822, 18116, 17720, 17523, 17457, 17230, and 17196 areas. Additional technically significant areas include the 15900, 15512, 15313, 14500, 14364, 13369, 10727, 10432, 9682, 8837, and 7538 levels. Traders are observing that the 50-bar MA (4-hourly) is bearishly indicating below the 100-bar MA (4-hourly) and below the 200-bar MA (4-hourly). Also, the 50-bar MA (hourly) is bullishly indicating above the 100-bar MA (hourly) and above the 200-bar MA (hourly).
Price activity is nearest the 200-bar MA (4-hourly) at 22973.11 and the 50-bar MA (Hourly) at 24834.57.
Technical Support is expected around 21753.70/ 19568.52/ 18390.99 with Stops expected below.
Technical Resistance is expected around 26931.99/ 27609.48/ 28004.20 with Stops expected above.
On 4-Hourly chart, SlowK is Bullishly above SlowD while MACD is Bearishly below MACDAverage.
On 60-minute chart, SlowK is Bearishly below SlowD while MACD is Bullishly above MACDAverage.
Disclaimer: Sally Ho’s Technical Analysis is provided by a third party, and for informational purposes only. It does not reflect the views of Crypto Daily, nor is it intended to be used as legal, tax, investment, or financial advice.

Related Stories