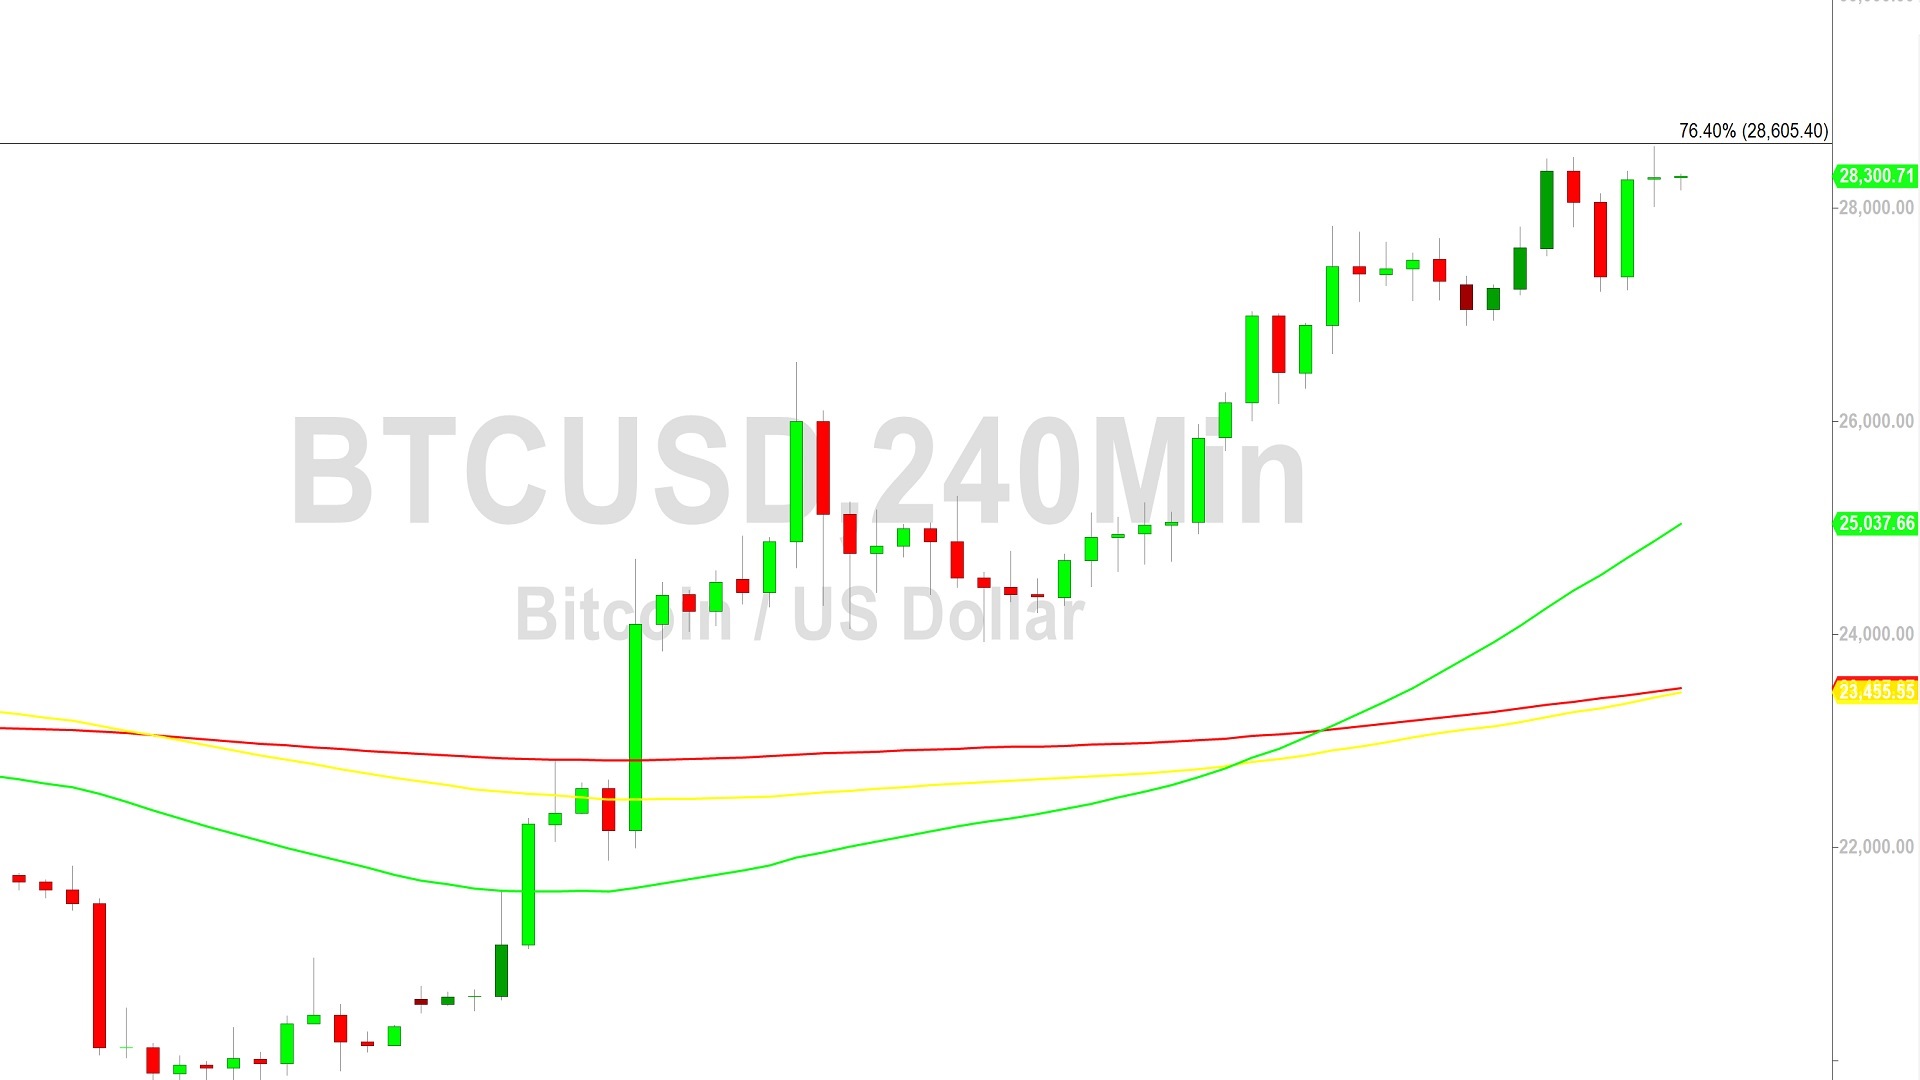
Bitcoin Price Analysis: 28605 Resistance Tested - 21 March 2023
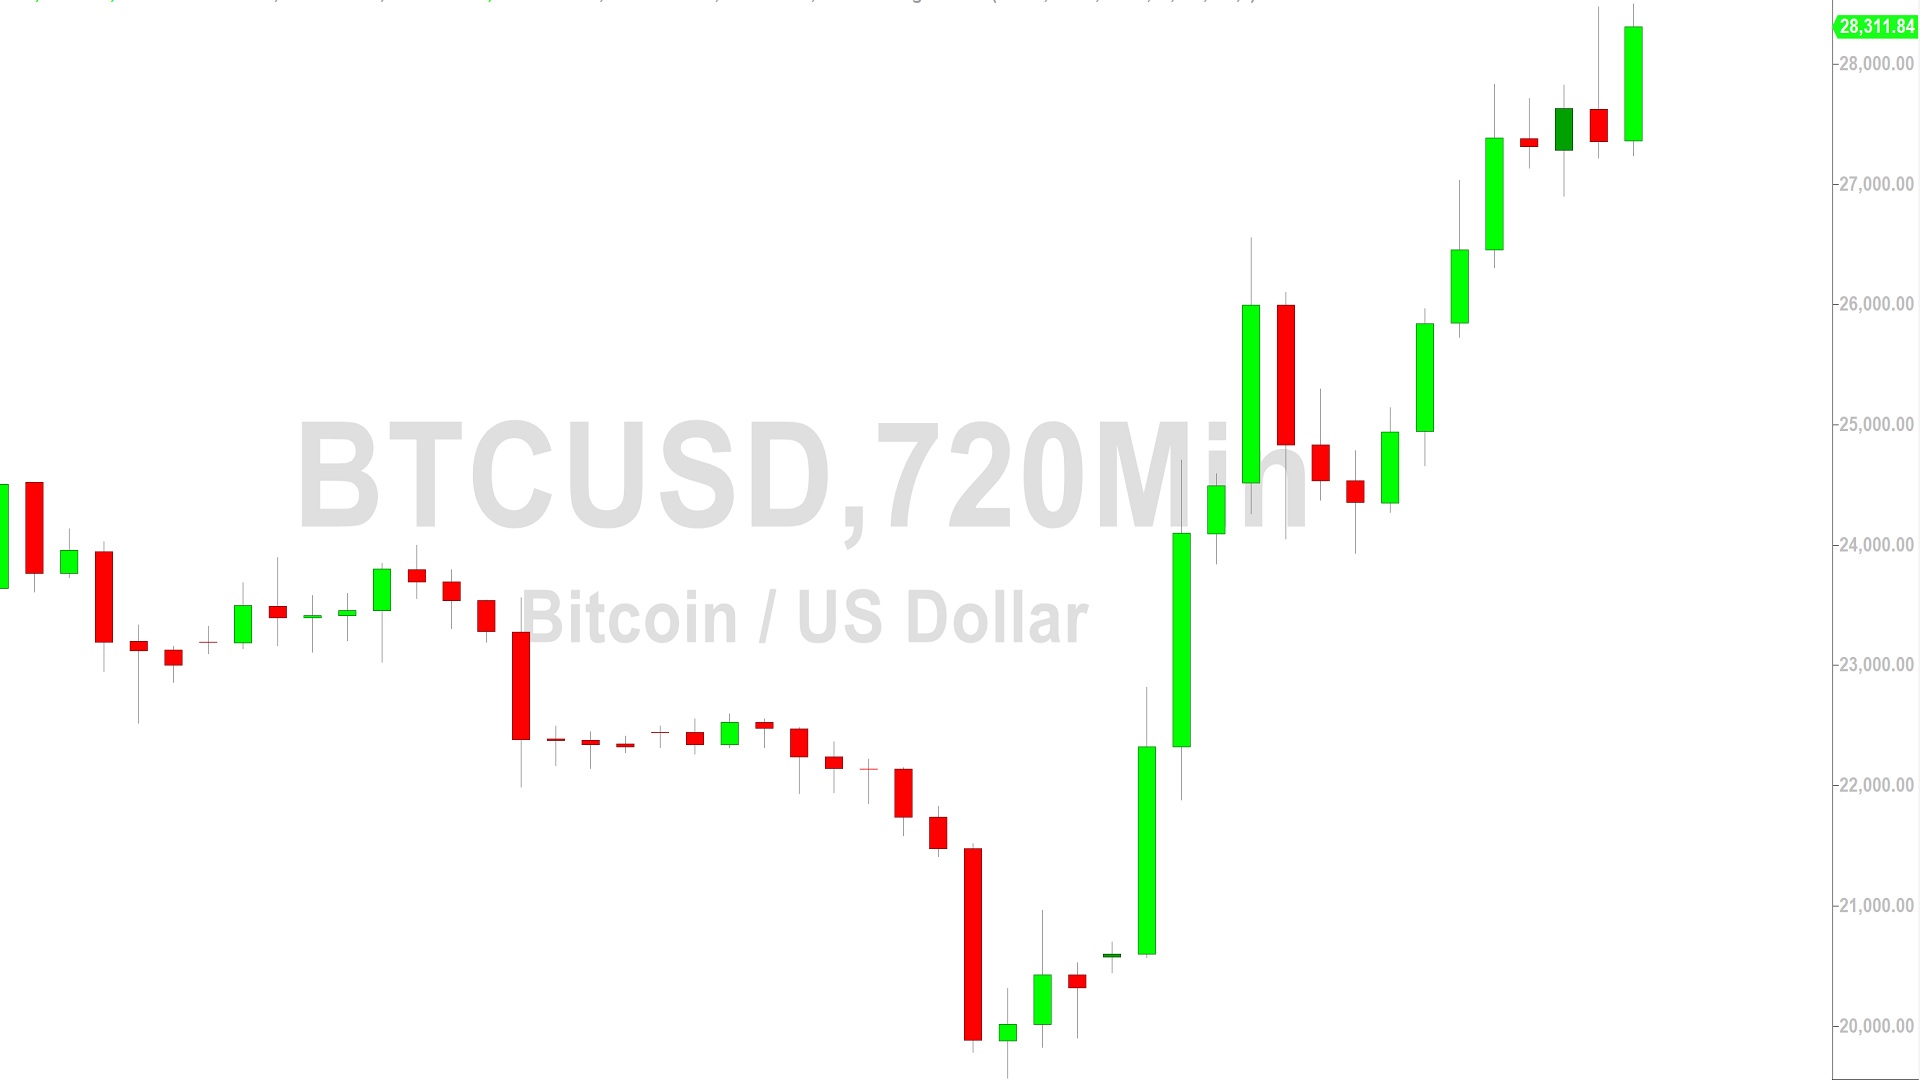
BTC/USD Extends Major Rally: Sally Ho’s Technical Analysis – 21 March 2023
Bitcoin (BTC/USD) extended its recent rally early in the Asian session as the pair rocketed to its strongest print since early June 2023, testing selling pressure around the 28578.63 level. Stops were elected above the 27901.68 and 28004.20 levels during the ascent, upside price objectives related to buying pressure that strengthened around the 19568.52 and 20370.01 levels. Prior to this most recent upward wave of buying activity, Stops were elected above the 27609.48 and 26931.99 areas. Following the recent appreciation, upside price objectives include the 29244.66, 29639.37, 30127.80, 30275.12, 30763.09, and 31477.37. Buying pressure emerged around the 27218.36 level during a brief pullback, an upside price objective related to buying pressure around the 15460 level.
Traders recently lifted BTC/USD from the 24064.72 area during a recent pullback, a level that represents the 78.6% retracement of the depreciating range from 25288.88 to 19568.52. Following the ongoing appreciation, retracement levels and areas of potential technical support include the 27481, 26998, 26803, 26452, 26254, 26020, 25706, 25230, and 25136 levels. Below current price activity, downside price objectives include the 19266, 19132, 19106, 19006, 18981, 18919, 18822, 18116, 17720, 17523, 17457, 17230, and 17196 areas. Traders are observing that the 50-bar MA (4-hourly) is bullishly indicating above the 100-bar MA (4-hourly) and above the 200-bar MA (4-hourly). Also, the 50-bar MA (hourly) is bullishly indicating above the 100-bar MA (hourly) and above the 200-bar MA (hourly).
Price activity is nearest the 50-bar MA (4-hourly) at 25035.71 and the 50-bar MA (Hourly) at 27637.01.
Technical Support is expected around 25256.83/ 24224.60/ 21753.70 with Stops expected below.
Technical Resistance is expected around 29244.66/ 29639.37/ 30127.80 with Stops expected above.
On 4-Hourly chart, SlowK is Bullishly above SlowD while MACD is Bearishly below MACDAverage.
On 60-minute chart, SlowK is Bearishly below SlowD while MACD is Bullishly above MACDAverage.
Disclaimer: Sally Ho’s Technical Analysis is provided by a third party, and for informational purposes only. It does not reflect the views of Crypto Daily, nor is it intended to be used as legal, tax, investment, or financial advice.

Related Stories