Bitcoin Price Analysis: Dominated by Technicals - 9 February 2023
BTC/USD Dominated by Technicals: Sally Ho’s Technical Analysis – 9 February 2023
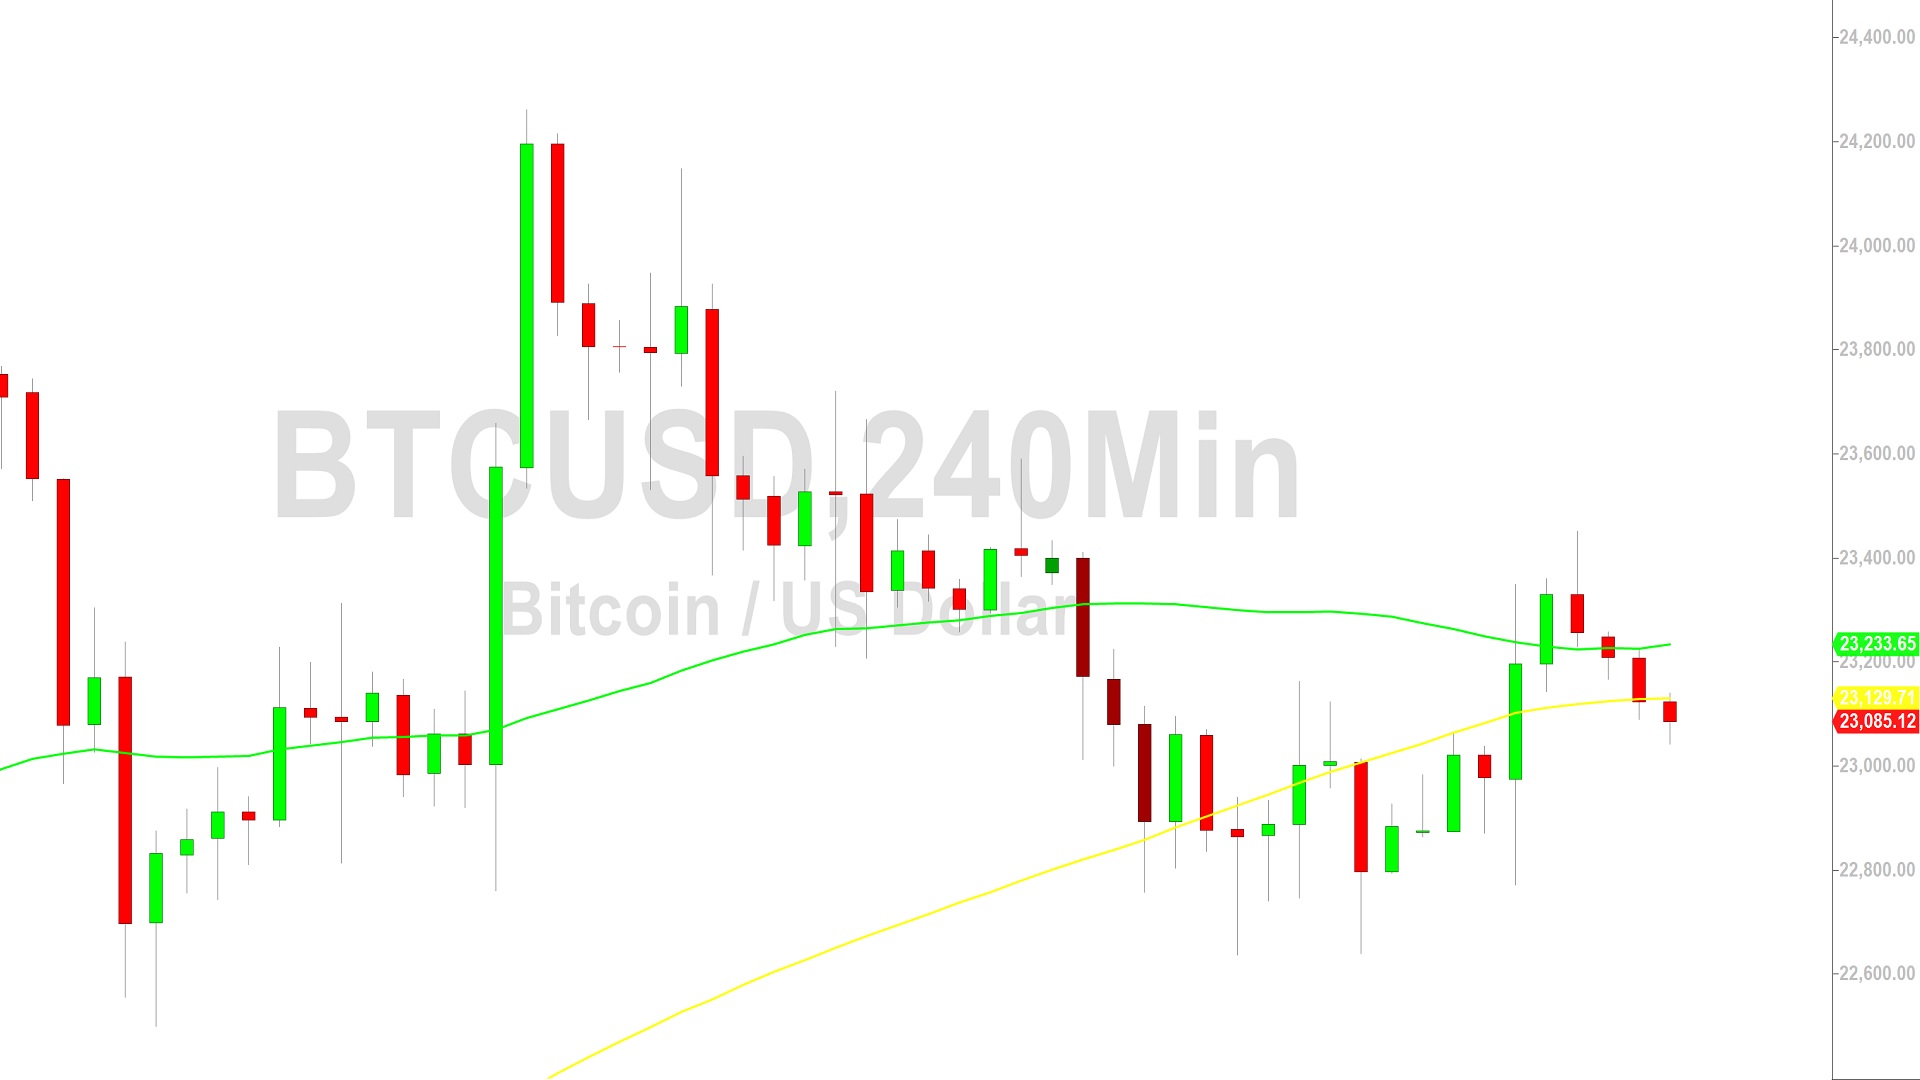
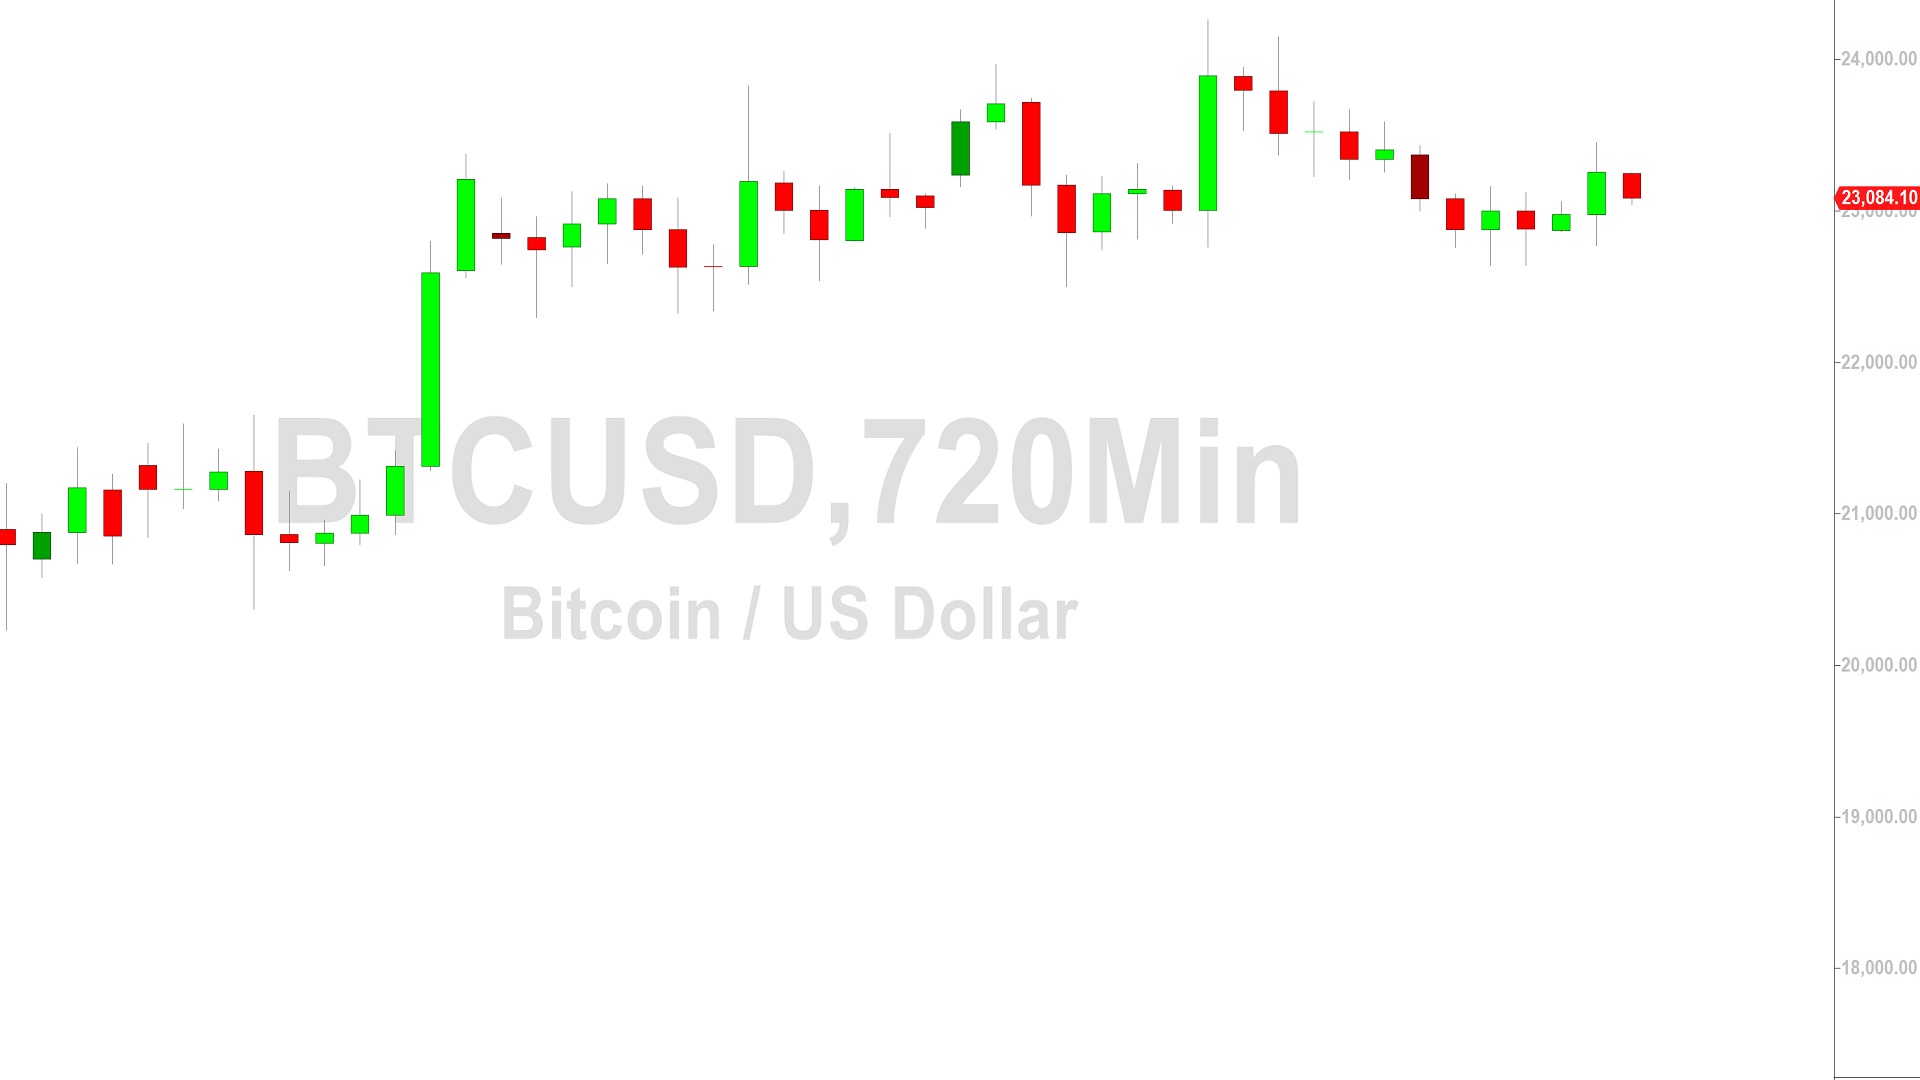
Bitcoin (BTC/USD) continued to be dominated by technicals early in the Asian session as the pair encountered selling pressure around the 23451.01 level, right around the 50% retracement of the depreciating range from 24262.18 to 22637.51. Prior to this move higher, buying pressure emerged around the 22772.01 area, right around the 38.2% retracement of the appreciating range from 20370.01 to 24262.18. The recent surge to the 24262.18 area occurred after Stops were elected above the 24224.60 level, an upside price objective related to buying pressure that emerged around the 15460 and 20370.01 areas. Upside price objectives related to buying pressure around the 16326.16 area include the 25455, 25774, 27609, and 28004 levels.
Upside price objectives related to buying pressure around the 15460 area include the 26612, 26931, 29244, and 29639 levels. Following the recent move higher to multi-month highs, technical support levels and areas of potential buying pressure are around the 22389, 22184, 21230, 20294, 19861, 19357, and 18822 levels. Stops are cited below the 18199, 18024, 17537, and 17343 levels. Below current price activity, technically significant areas include the 15900, 15512, 15313, 14500, 14364, 13369, 10727, 10432, 9682, 8837, and 7538 levels. Traders are observing that the 50-bar MA (4-hourly) is bullishly indicating above the 100-bar MA (4-hourly) and above the 200-bar MA (4-hourly). Also, the 50-bar MA (hourly) is bearishly indicating below the 100-bar MA (hourly) and below the 200-bar MA (hourly).
Price activity is nearest the 100-bar MA (4-hourly) at 23129.67 and the 100-bar MA (Hourly) at 23104.87.
Technical Support is expected around 18390.99/ 16714.46/ 14500.15 with Stops expected below.
Technical Resistance is expected around 25455.06/ 25774.41/ 26612.64 with Stops expected above.
On 4-Hourly chart, SlowK is Bearishly below SlowD while MACD is Bullishly above MACDAverage.
On 60-minute chart, SlowK is Bullishly above SlowD while MACD is Bearishly below MACDAverage.
Disclaimer: Sally Ho’s Technical Analysis is provided by a third party, and for informational purposes only. It does not reflect the views of Crypto Daily, nor is it intended to be used as legal, tax, investment, or financial advice.

Related Stories