Bitcoin Price Analysis: Cautious Above 23000 - 2 February 2023
BTC/USD Notches Marginal Ground: Sally Ho’s Technical Analysis – 2 February 2023
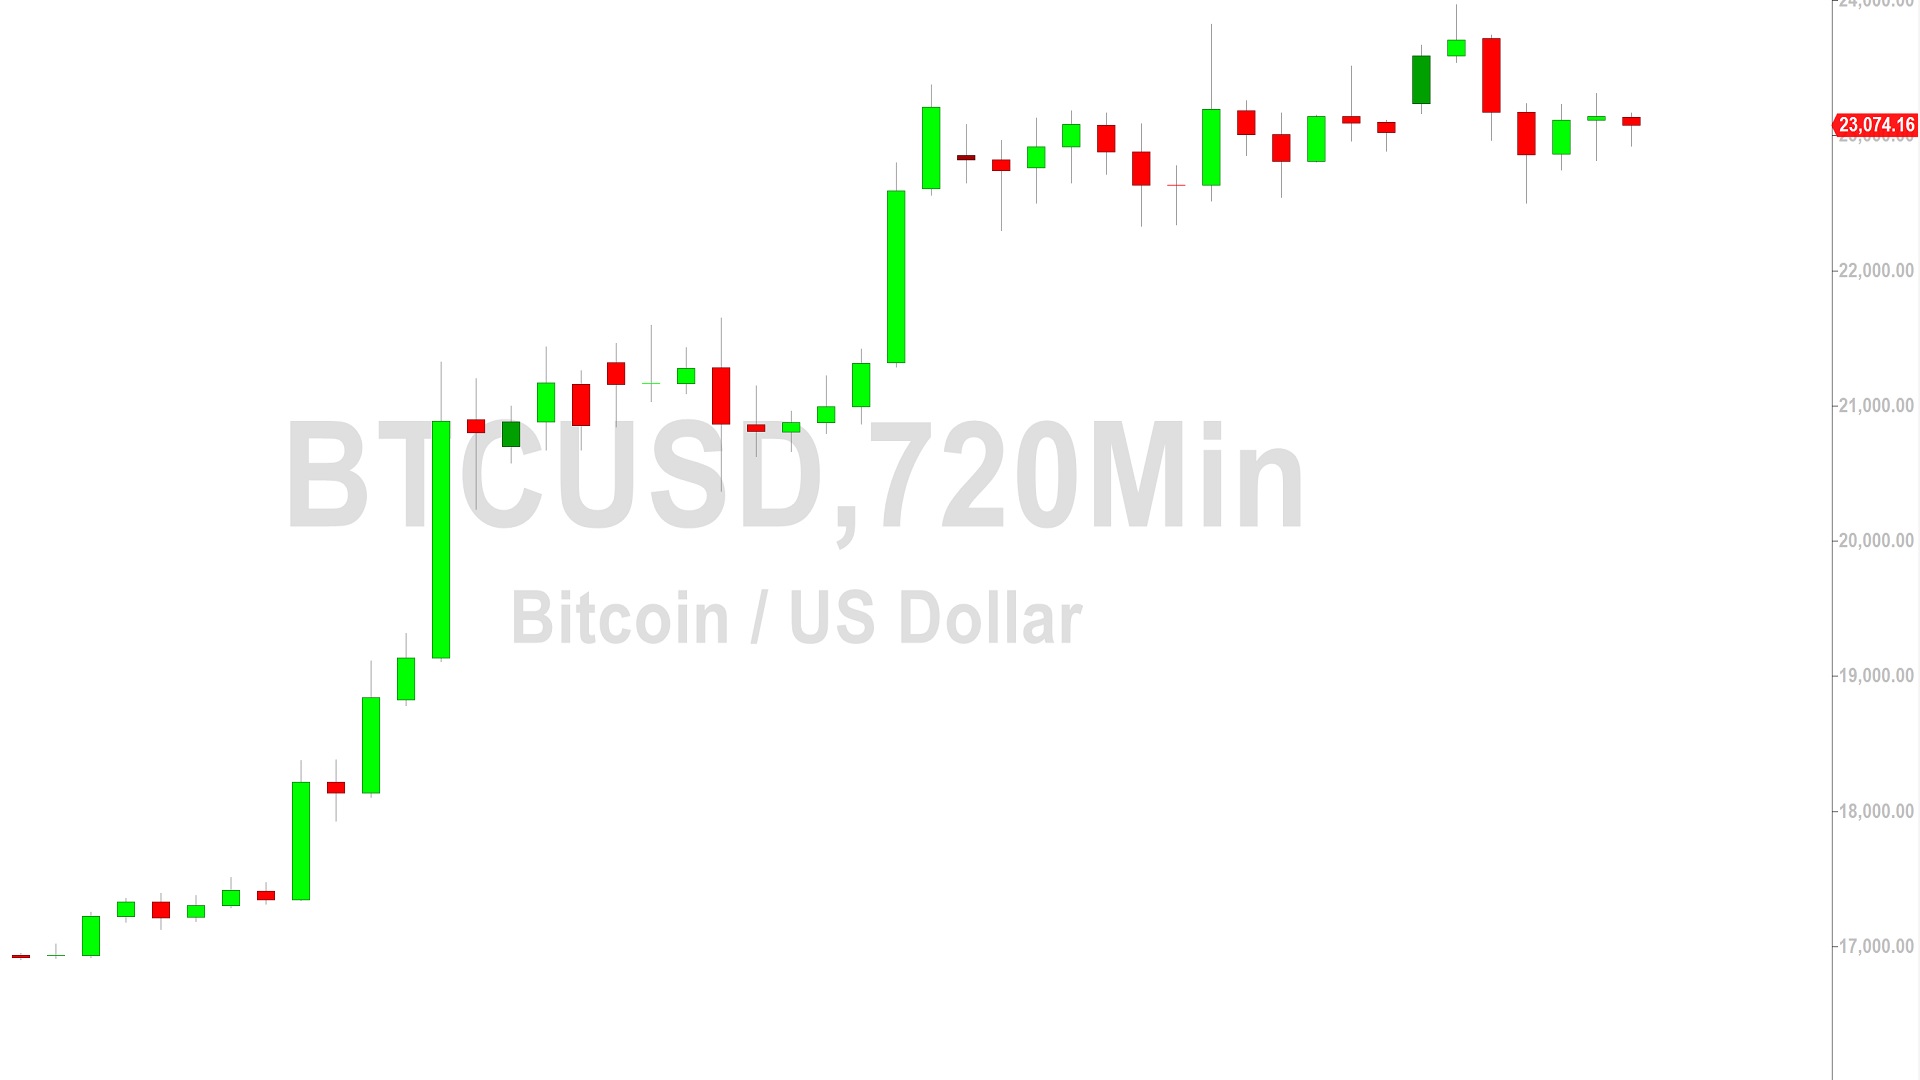
Bitcoin (BTC/USD) glided cautiously higher early in the Asian session as the pair moved back above the 23000 figure after encountering buying pressure around the 22812.93 area. The pair’s upside was earlier limited by selling pressure around the 23313.23 area, a level that represented a test of an upside price objective linked to previous demand around the 16326.16 and 20233.33 areas. BTC/USD appreciated nearly 39% in January and is up approximately 49% from its 2022 low of 15460. The move to recent multi-month highs also represented a test of the 23980.62 area, an upside price objective related to buying pressure that strengthened around the 15460 and 20233 levels during the past several weeks. Upside price objectives related to buying pressure around the 16326.16 area include the 25455, 25774, 27609, and 28004 levels. Upside price objectives related to buying pressure around the 15460 area include the 23980, 24224, 26612, 26931, 29244, and 29639 levels.
Following the recent move higher to multi-month highs, technical support levels and areas of potential buying pressure are around the 22163, 21047, 20146, 19244, 18129, and 17961 levels. Stops are cited below the 21437, 20874, 20724, 20370, 20233, 20026, 19153, 18448, and 18253 levels. Below current price activity, technically significant areas include the 15900, 15512, 15313, 14500, 14364, 13369, 10727, 10432, 9682, 8837, and 7538 levels. Traders are observing that the 50-bar MA (4-hourly) is bullishly indicating above the 100-bar MA (4-hourly) and above the 200-bar MA (4-hourly). Also, the 50-bar MA (hourly) is bearishly indicating below the 100-bar MA (hourly) and below the 200-bar MA (hourly).
Price activity is nearest the 50-bar MA (4-hourly) at 23059.87 and the 200-bar MA (Hourly) at 23053.81.
Technical Support is expected around 18390.99/ 16714.46/ 14500.15 with Stops expected below.
Technical Resistance is expected around 23980.62/ 24224.60/ 25455.06 with Stops expected above.
On 4-Hourly chart, SlowK is Bullishly above SlowD while MACD is Bearishly below MACDAverage.
On 60-minute chart, SlowK is Bullishly above SlowD while MACD is Bearishly below MACDAverage.
Disclaimer: Sally Ho’s Technical Analysis is provided by a third party, and for informational purposes only. It does not reflect the views of Crypto Daily, nor is it intended to be used as legal, tax, investment, or financial advice.

Related Stories