Bitcoin Price Analysis: Bears Eyeing 22074 - 25 February 2023
BTC/USD Bears Growling: Sally Ho’s Technical Analysis – 25 February 2023
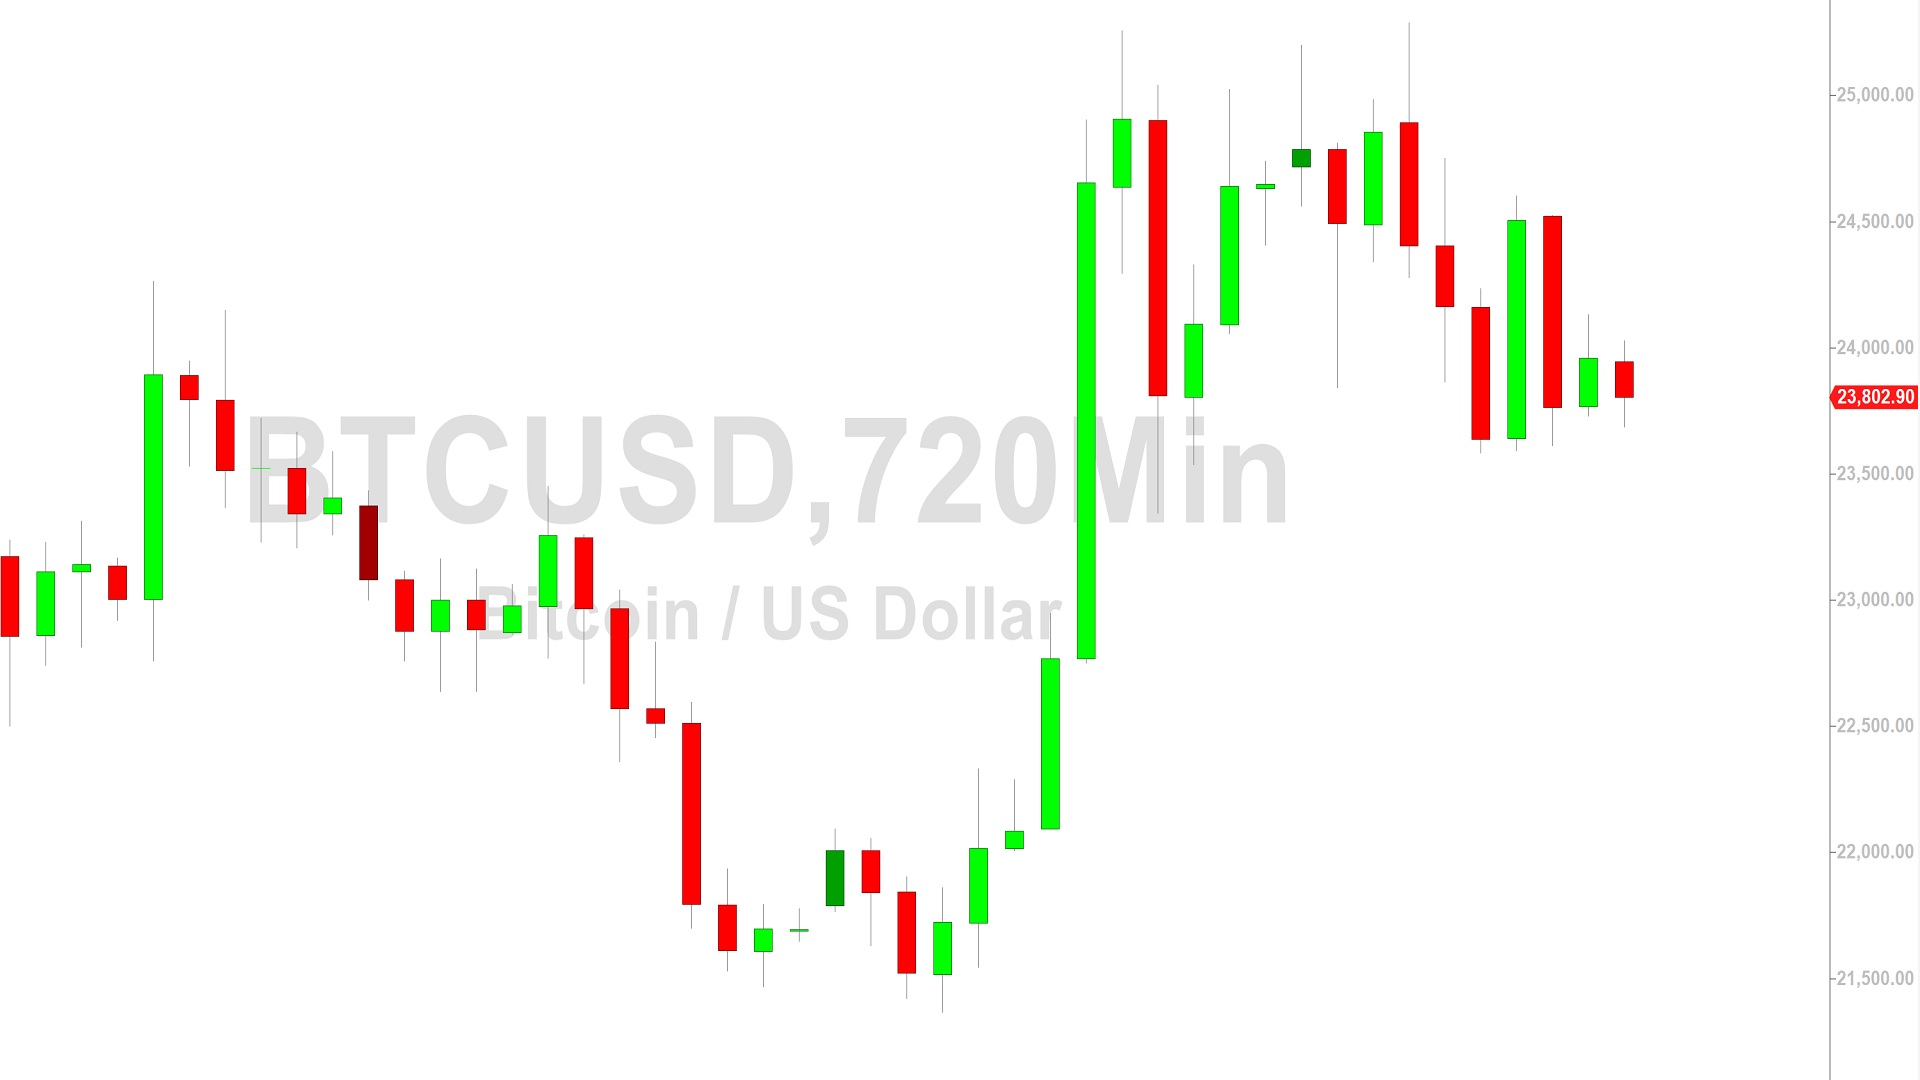
Bitcoin (BTC/USD) experienced weaker technical sentiment early in the Asian session as the pair was capped around the 24027.97 level before coming off, a bearish test of a price objective associated with selling pressure around the 25288.88 and 24749.96 levels. Technical trading activity was evident when selling pressure slowed around the 23685 area, representing a test of a downside price objective associated with selling pressure that strengthened around the 24600.95 area. Additional downside price objectives include the 23496, 23364, 23302, 22943, 22832, 22770, and 22074 levels. The recent move higher to a fresh multi-month high around 25288.88 also represented a test of the 25455 level, an upside price objective related to historical buying pressure around the 16326.16 and 20333.33 areas. Upside price objectives related to buying pressure around the 16326.16 area include the 25455, 25774, 27609, and 28004 levels.
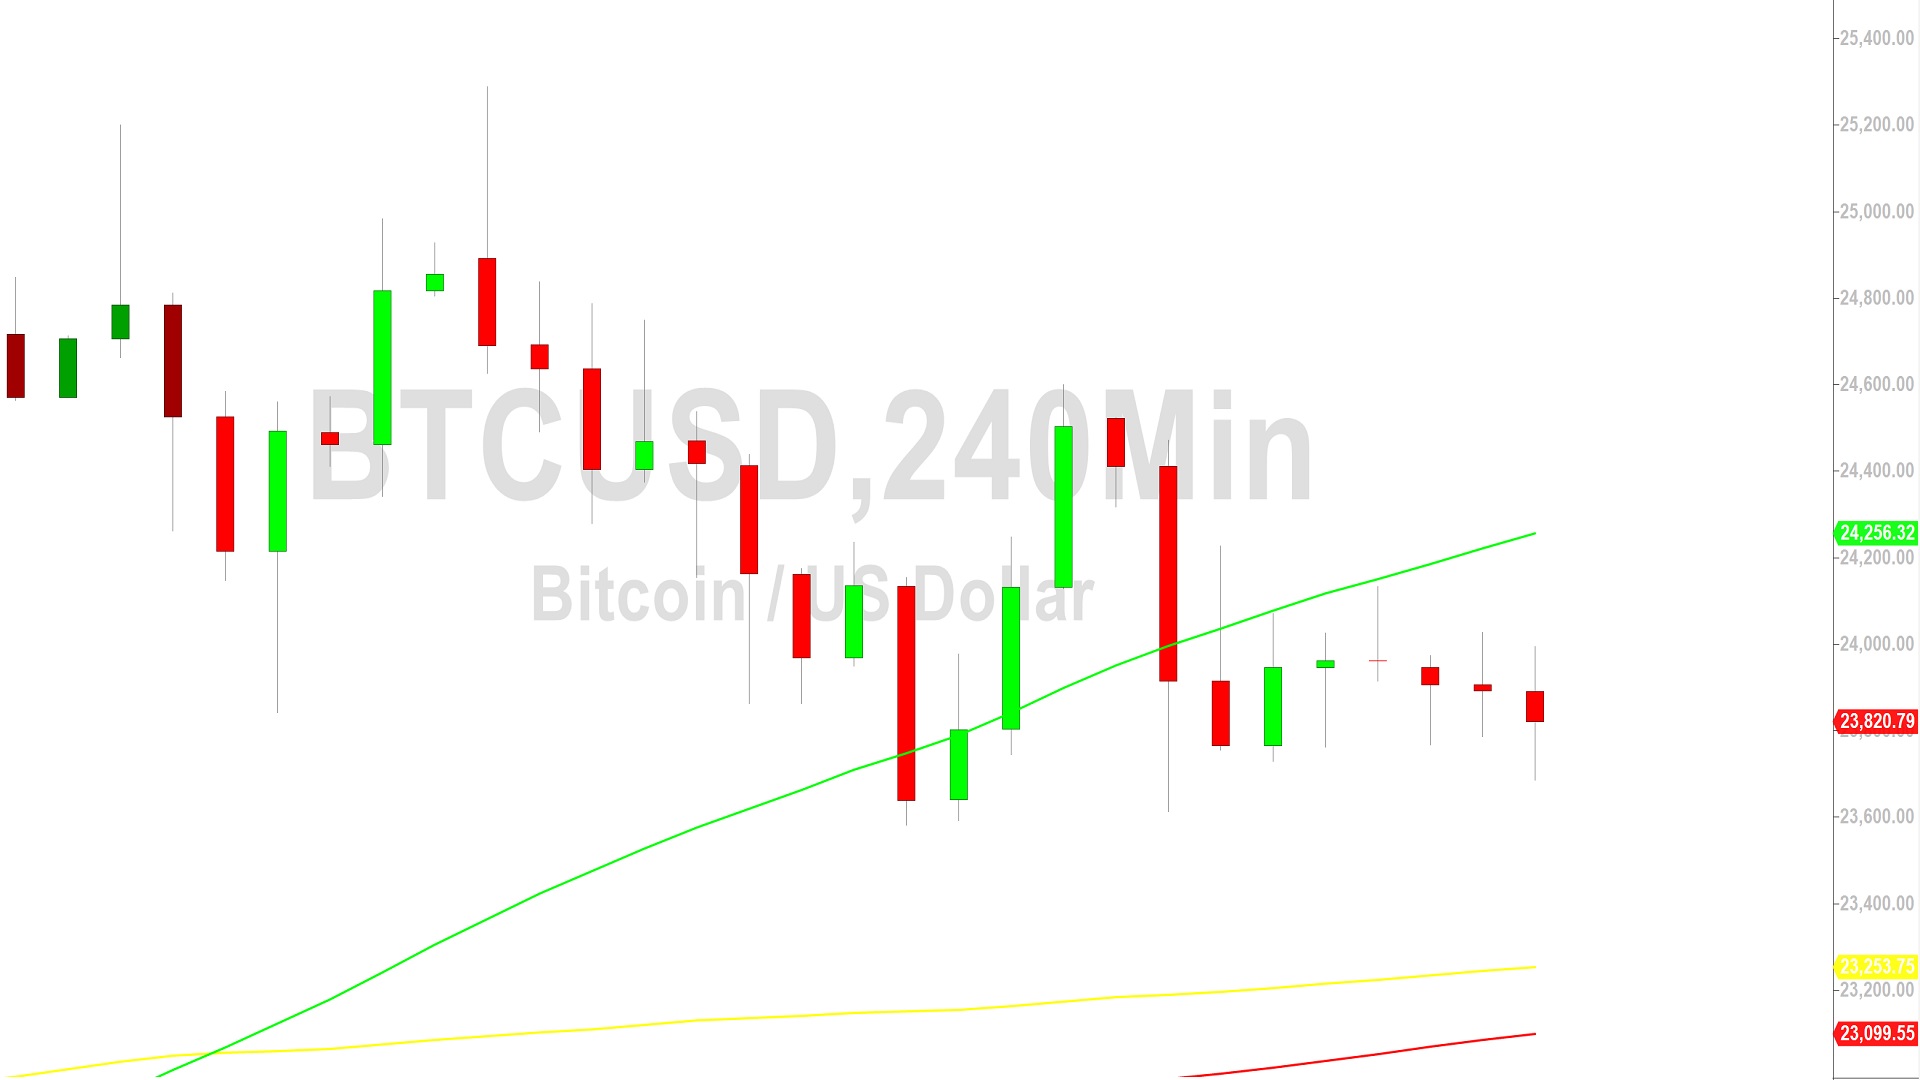
Upside price objectives related to buying pressure around the 15460 area include the 26612, 26931, 29244, and 29639 levels. Following the recent move higher to multi-month highs, technical support levels and areas of potential buying pressure are around the 22944, 22717, 23171, 22236, 22201, 21523, 21514, 21416, 21366, and 20791 areas. Stops are cited below the 21047, 20874, 20724, and 20370 levels. Below current price activity, technically significant areas include the 15900, 15512, 15313, 14500, 14364, 13369, 10727, 10432, 9682, 8837, and 7538 levels. Traders are observing that the 50-bar MA (4-hourly) is bullishly indicating above the 100-bar MA (4-hourly) and above the 200-bar MA (4-hourly). Also, the 50-bar MA (hourly) is bearishly indicating below the 100-bar MA (hourly) and below the 200-bar MA (hourly).
Price activity is nearest the 50-bar MA (4-hourly) at 24256.11 and the 50-bar MA (Hourly) at 23994.07.
Technical Support is expected around 18390.99/ 16714.46/ 14500.15 with Stops expected below.
Technical Resistance is expected around 25455.06/ 25774.41/ 26612.64 with Stops expected above.
On 4-Hourly chart, SlowK is Bearishly below SlowD while MACD is Bearishly below MACDAverage.
On 60-minute chart, SlowK is Bearishly below SlowD while MACD is Bearishly below MACDAverage.
Disclaimer: Sally Ho’s Technical Analysis is provided by a third party, and for informational purposes only. It does not reflect the views of Crypto Daily, nor is it intended to be used as legal, tax, investment, or financial advice.

Related Stories