Bitcoin Price Analysis: Minor Ground Ceded - 23 January 2023
BTC/USD Cedes Minor Ground: Sally Ho’s Technical Analysis – 23 January 2023
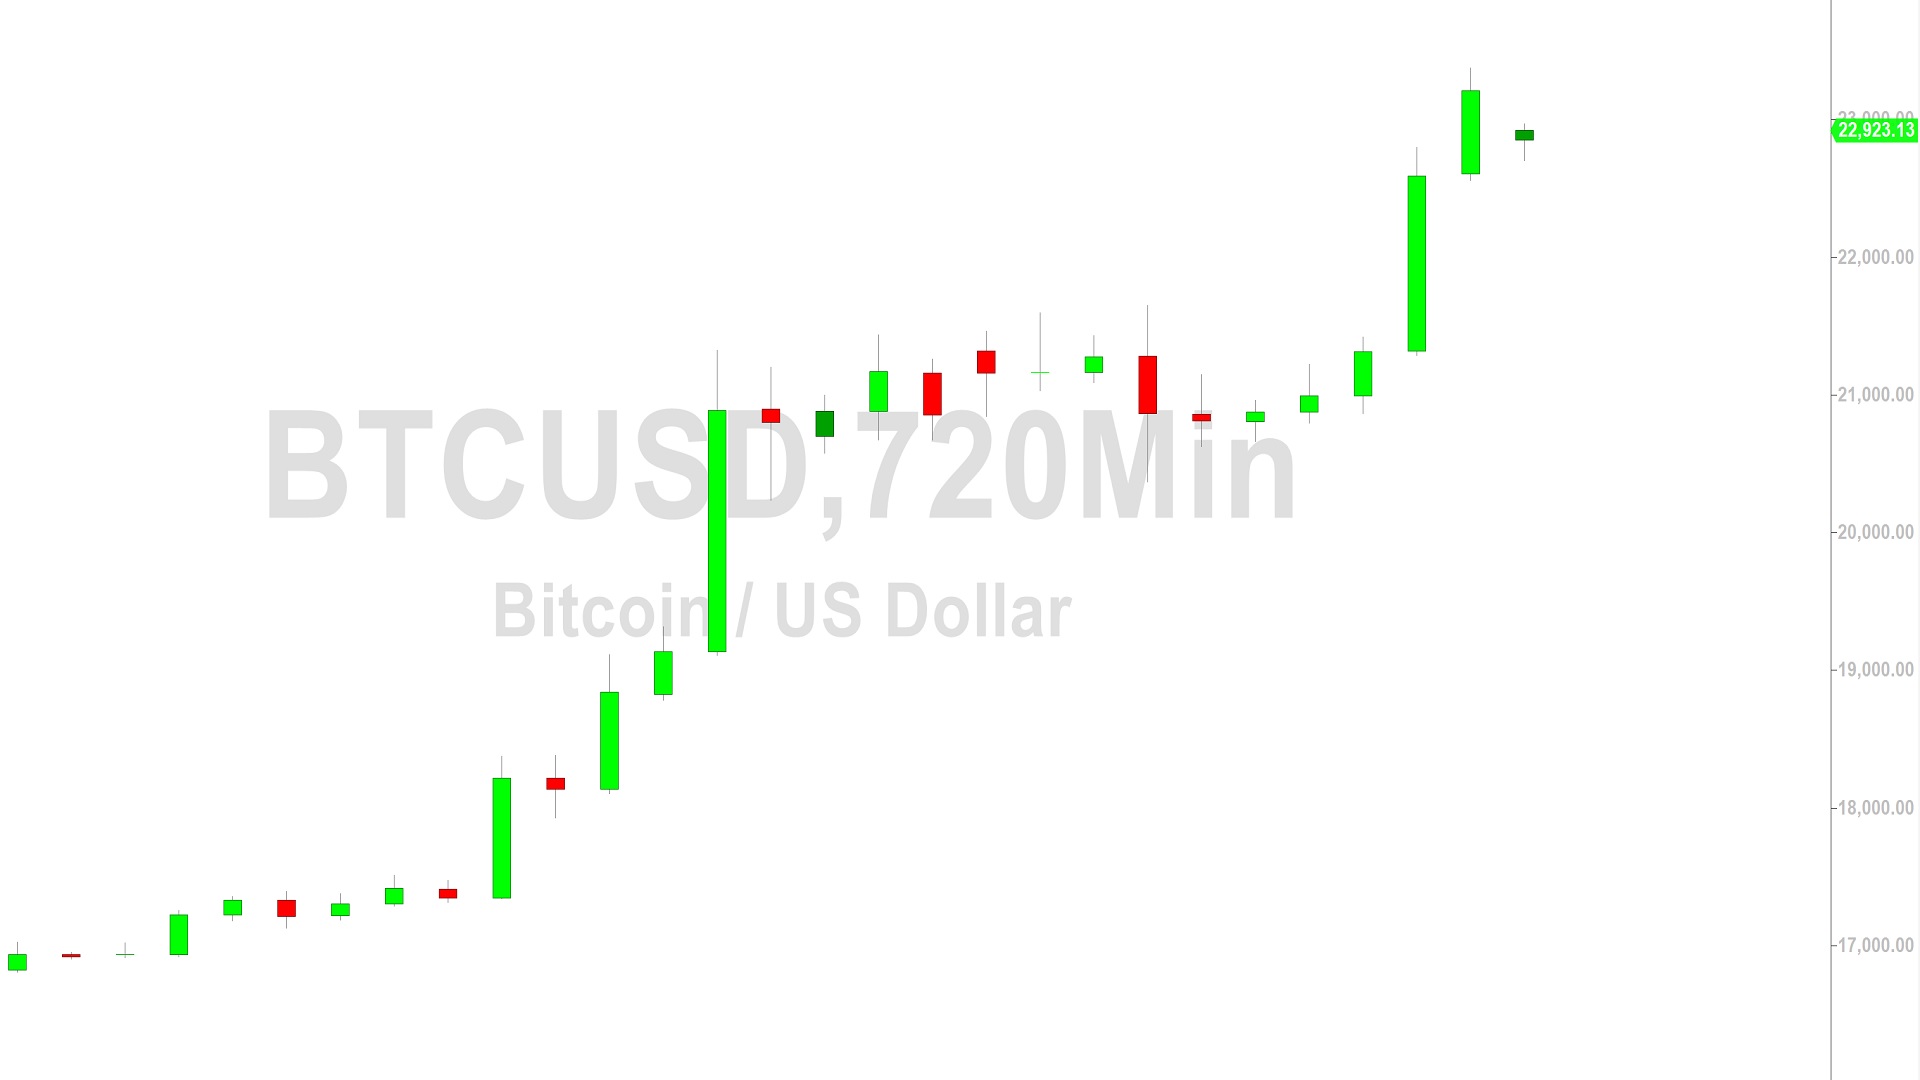
Bitcoin (BTC/USD) ceded some minor ground early in the Asian session as the pair faded to the 22700 area after trading as high as the 23375.60 area, its strongest print since August 2022. Stops were elected above the 22042.59 area during the recent appreciation, an upside price objective related to buying pressure around the 16326.16 and 17927.36 areas. The fresh 5-month high represented a test of the 23300.64 area, an upside price objective related to buying pressure that strengthened around the 20333.33 area. Upside price objectives related to buying pressure around the 16326.16 area include the 23544, 23808, 25455, 25774, 27609, and 28004 levels. Upside price objectives related to buying pressure around the 15460 area include the 23980, 24224, 26612, 26931, 29244, and 29639 levels.
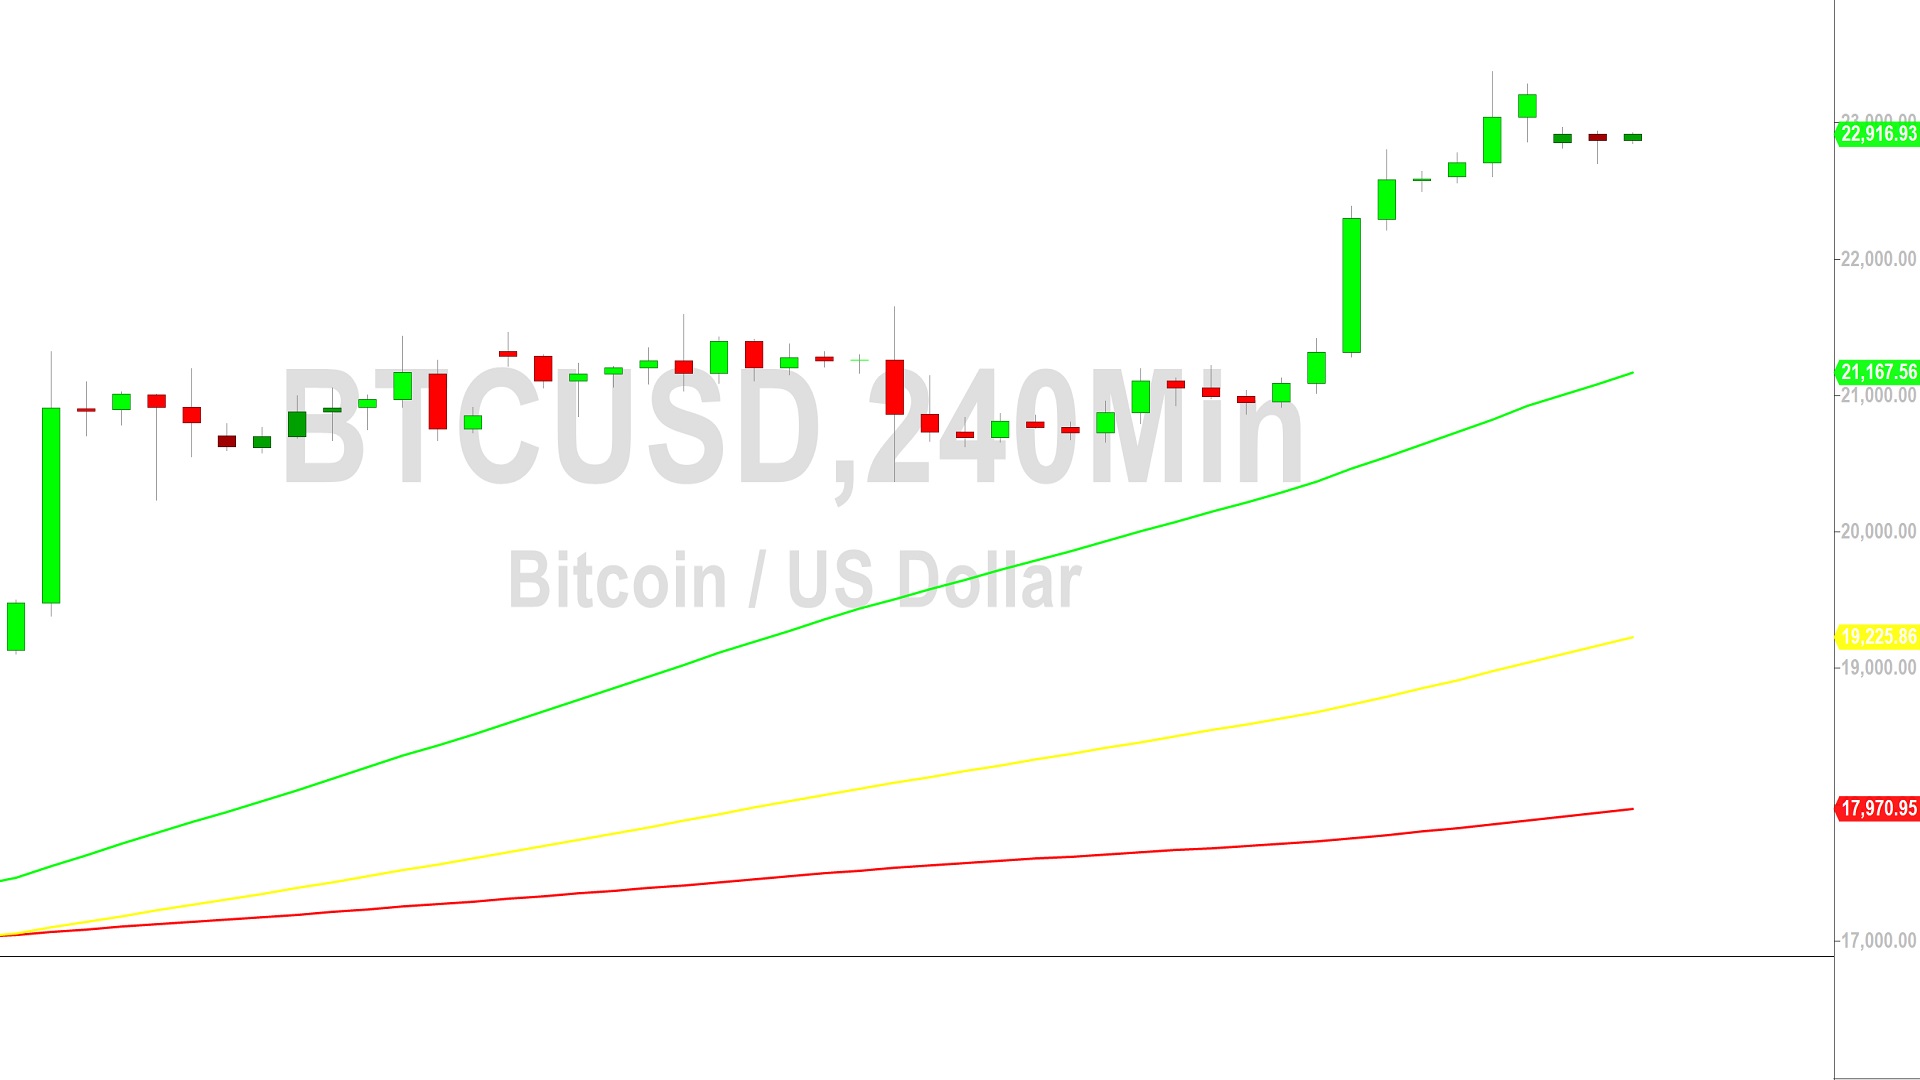
Following the recent move higher to multi-month highs, technical support levels and areas of potential buying pressure are around the 21711, 20682, 19850, 19019, 17989, and 17834 levels. Stops are cited below the 21437, 20874, 20724, 20370, 20233, 20026, 19153, 18448, and 18253 levels. Below current price activity, technically significant areas include the 15900, 15512, 15313, 14500, 14364, 13369, 10727, 10432, 9682, 8837, and 7538 levels. Traders are observing that the 50-bar MA (4-hourly) is bullishly indicating above the 100-bar MA (4-hourly) and above the 200-bar MA (4-hourly). Also, the 50-bar MA (hourly) is bullishly indicating above the 100-bar MA (hourly) and above the 200-bar MA (hourly).
Price activity is nearest the 50-bar MA (4-hourly) at 21167.49 and the 50-bar MA (Hourly) at 22141.23.
Technical Support is expected around 18390.99/ 16714.46/ 14500.15 with Stops expected below.
Technical Resistance is expected around 23544.62/ 24224.60/ 25455.06 with Stops expected above.
On 4-Hourly chart, SlowK is Bearishly below SlowD while MACD is Bullishly above MACDAverage.
On 60-minute chart, SlowK is Bullishly above SlowD while MACD is Bearishly below MACDAverage.
Disclaimer: Sally Ho’s Technical Analysis is provided by a third party, and for informational purposes only. It does not reflect the views of Crypto Daily, nor is it intended to be used as legal, tax, investment, or financial advice.

Related Stories