Bitcoin Price Analysis: 17265 Tested Again - 10 December 2022
BTC/USD Elects Stops Above 17265: Sally Ho’s Technical Analysis – 9 December 2022
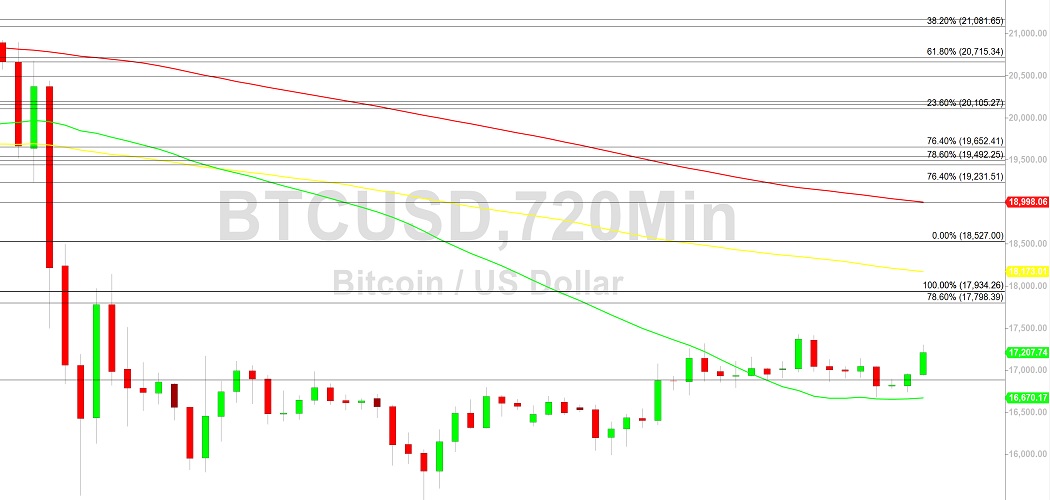
Bitcoin (BTC/USD) worked to sustain recent gains early in the Asian session as the pair elected Stops above the 17265.15 level, representing the 78.6% retracement of the recent depreciating range from 17424.59 to 16679.52. Recent upside progress has increased risk that Stops above the 17424.59 area could be tested and lead to a test of the 17759.18 area, representing the 38.2% retracement of the depreciating range from 21478.80 to 15460. Additional upside retracement levels in this depreciating range include the 18469 and 19179 areas. Traders are watching to see if BTC/USD can establish a constructive base around the 16880 area, representing the 23.6% retracement of the depreciating range. If BTC/USD is able to extend its upward trajectory, upside areas of potential technical resistance and selling pressure include the 17791, 18495, 19199, 20070, and 20201 levels.
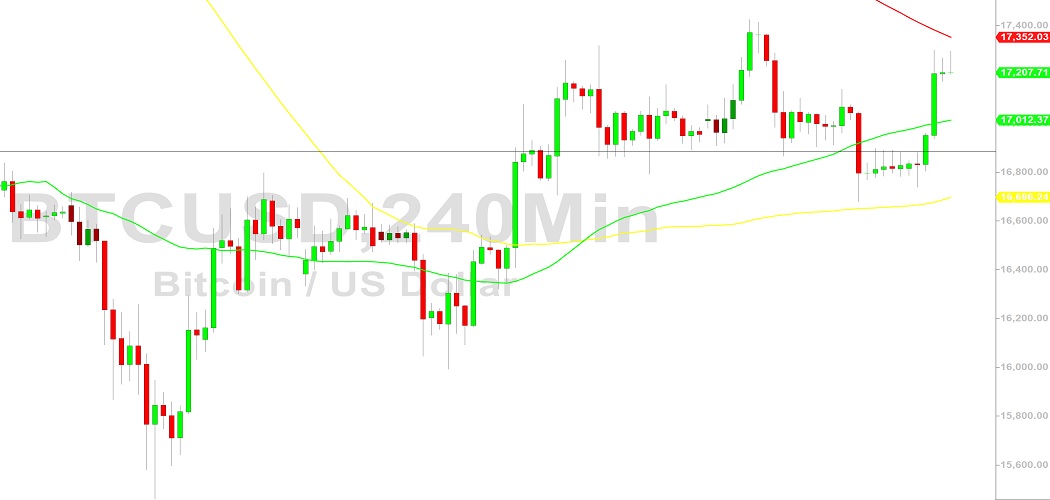
Below current price activity, BTC/USD bears are eyeing a possible test of recent two-year lows around the 15460 area, established after Stops were elected below the 15512 area. Notably, this 15512 level represented an exact bearish price objective based on selling pressure that strengthened around the 21478.80 and 18495.50 areas. Associated downside price objectives below current price activity include the 13369, 8837, and 7538 levels. Technicians continue to eye the 14500.15 and 10432.73 areas as major downside targets, and additional downside price objectives include the 14613, 10727, and 9682 levels, areas that are related to selling pressure that intensified around the 20894.96 and 18495.50 areas. Traders are observing that the 50-bar MA (4-hourly) is bearishly indicating below the 200-bar MA (4-hourly) and above the 100-bar MA (4-hourly). Also, the 50-bar MA (hourly) is bearishly indicating below the 100-bar MA (hourly) and below the 200-bar MA (hourly).
Price activity is nearest the 200-bar MA (4-hourly) at 17352.03 and the 100-bar MA (Hourly) at 17007.11.
Technical Support is expected around 14500.15/ 13369.11/ 10727.75 with Stops expected below.
Technical Resistance is expected around 18495.40/ 19199.48/ 20070.64 with Stops expected above.
On 4-Hourly chart, SlowK is Bullishly above SlowD while MACD is Bullishly above MACDAverage.
On 60-minute chart, SlowK is Bearishly below SlowD while MACD is Bullishly above MACDAverage.
Disclaimer: Sally Ho’s Technical Analysis is provided by a third party, and for informational purposes only. It does not reflect the views of Crypto Daily, nor is it intended to be used as legal, tax, investment, or financial advice.

Related Stories